EXHIBIT 99.2
FieldReport / Fiscal Q4 & Full Year 2019 Earnings Call / November 7 , 2019 The Industry Leader in Craft Friendly Fiber Optic Management and Connectivity Solutions Fiscal Q4 and FY 2019 Earnings Call FieldReport
FieldReport / Fiscal Q4 & Full Year 2019 Earnings Call / November 7 , 2019 Important Cautions Regarding Forward-Looking Statements NASDAQ:CLFD 2 • Forward-looking statements contained herein and in any related presentation or in t he related F iel d Report are made pursuant t o the safe harbor provisions of the Private Litigation Reform A ct of 1995. W ords such as “may,” “will,” “expect,” “believe , ” “anticipate,” “est i mate,” “outlook,” or “continue” or comparable terminology are intended t o identify f orward-looking statements. Such f orward looking statements i nc l ude, for example, statements about the C ompany’s future reven u e and operating pe r formance, i ntegration of the acquired active cabinet line, t re n ds in and growth of the FTTx markets, market segments or customer purchases, effect i ve n ess of t he C ompany’s sales and marketing strategies and org a nization, utilization of manufacturi n g capacity, and the develop me nt and marketing of products. These statements are based upon the Com p any's current expe ctations and judgments about future develop m ents i n the Co m pany's busines s . C ertain i mportant factors could have a materi a l impact on the Compa ny's performance, i ncludi ng , without limitation: further c onsolidation among our customers may result i n the loss of som e customers and may reduce sales during the pendency of busi n ess combinations a nd related integration activities; to compete effectivel y , we must continually improve existing pro ducts and introduce new products t hat achi e ve market acceptance; we must successfully i ntegrate t he acqui r ed active cabinet line in order to obtain t he anticipated financi a l results and c ustomer synergies within t he t imeframes expected; our operatin g results m ay fluctuate signi f i cantly from quarter to quarter, which may make budgeti n g for expenses difficult and may negatively affect the market p r ice of our c ommon stoc k ; our success depe n ds upon adeq u ate protection of our pat e nt and intellectu a l property rights; i ntense competition i n ou r industry may r esult in price reductions, lower gross profits and loss of market sh a re; we rely on single-source supplier s , which could cause dela y s, increases in costs or prevent us from completing customer orders, all of which could materially harm our busi n ess; a signi f i c a nt percenta g e of our s ale s i n the last t hree fiscal years have been made t o a small number of customers, an d t he l oss of t hese major customers or signific a nt decline in b u siness with t hese major customers would adver se ly affect us; our plan n ed i mple me ntation of information technology systems could result in signi f ic a nt disru ptions t o our operations; product defects or t he failure of our products to meet specifications could cause us to lose customers and sa l es or t o incur unexpected expenses; we are depe nde nt upon key personnel; we f a ce risks associated with expandi n g our sales outside of the Un i ted States ; our results of operations could be adversely affected by economic c onditions and the effects of t hese conditions on our customers ’ busines s es; and ot her factors set forth in Part I, Item IA. Risk F actors of Clearfie l d's Annual R eport on Form 10-K for the year ended Septem b er 30 , 2018 as well as other f ili n gs with the Securities and Exchange C ommission. The Compa n y undertakes no obligation to update these statements t o refle c t actual events unless required by law. © Copyright 2019 Clearfield, Inc. All Rights Reserved.

FieldReport / Fiscal Q4 & Full Year 2019 Earnings Call / November 7 , 2019 W el c o me Cheri Beranek PRESIDENT & CEO NASDAQ:CLFD 3
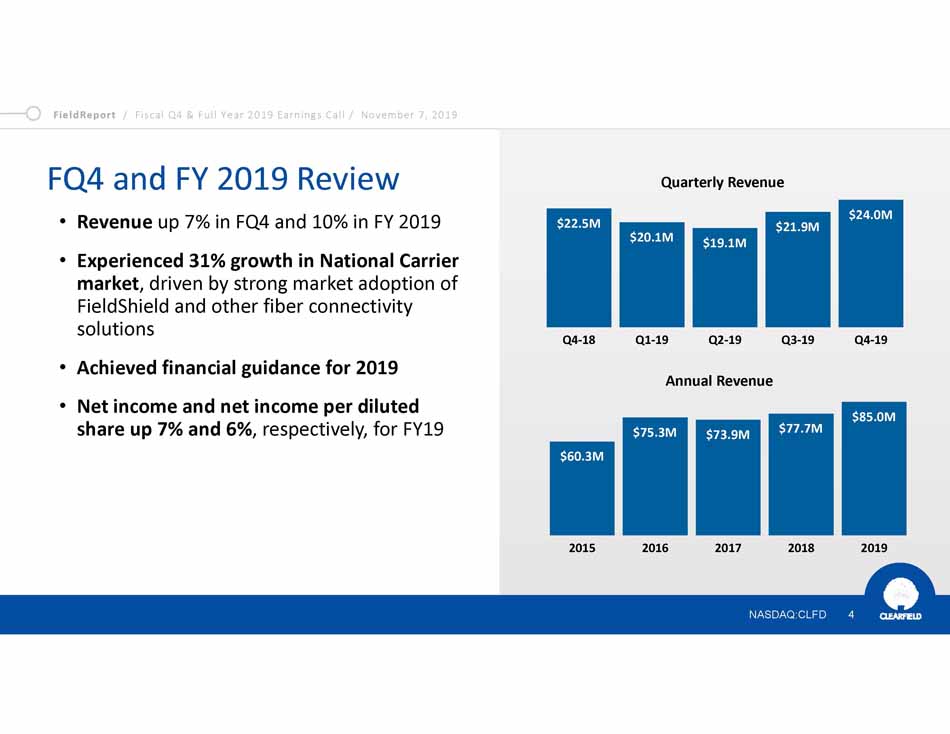
FieldReport / Fiscal Q4 & Full Year 2019 Earnings Call / November 7 , 2019 FQ4 and FY 2019 Review NASDAQ:CLFD 4 • Revenue up 7% in FQ4 and 10% in FY 2019 • Experienced 31% growth in National Carrier market , driven by strong market adoption of FieldShield and other fiber connectivity solutions • Achieved financial guidance for 2019 • Net income and net income per diluted share up 7% and 6% , respectively, for FY19 $22.5M $20.1M $19.1M $21.9M $24.0M Q4-18 Q3-19 Q4-19 Quarterly Revenue $60.3M $75.3M $73.9M $77.7M $85.0M 2015 2016 2017 2018 2019 Q1-19 Q2-19 Annual Revenue
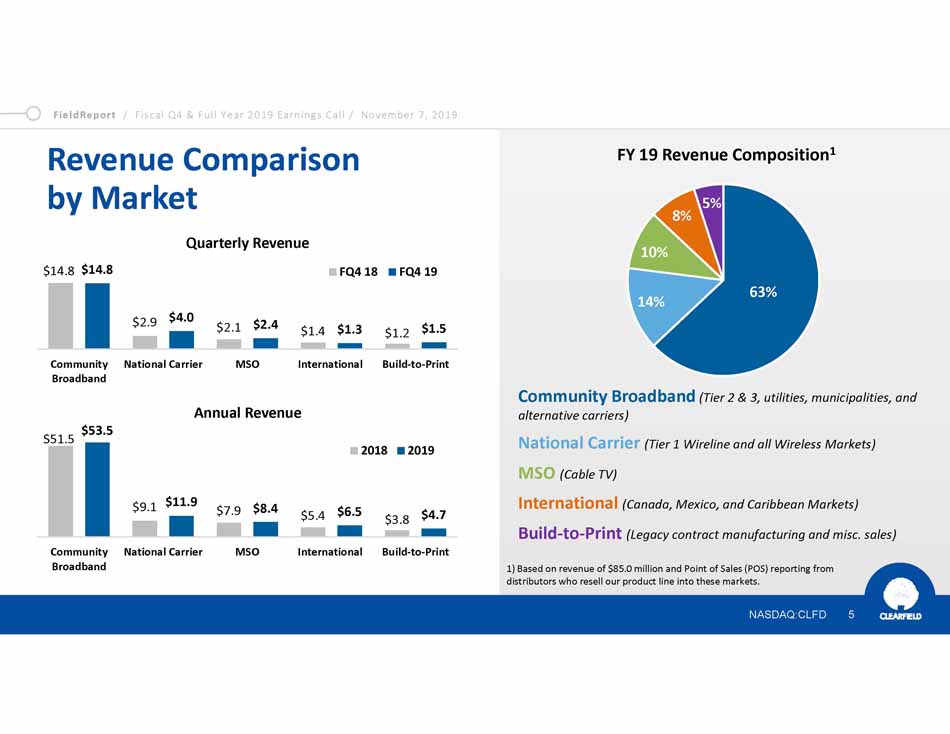
FieldReport / Fiscal Q4 & Full Year 2019 Earnings Call / November 7 , 2019 Revenue Comparison by Market 1) Based on revenue of $85.0 million and Point of Sales (POS) reporting from distributors who resell our product line into these markets. FY 19 Revenue Composition 1 Community Broadband (Tier 2 & 3, utilities, municipalities, and alternative carriers) National Carrier (Tier 1 Wireline and all Wireless Markets) MSO (Cable TV) International (Canada, Mexico, and Caribbean Markets) Build-to-Print (Legacy contract manufacturing and misc. sales) $2.9 $2.1 $1.4 $1.2 $14.8 $14.8 $4.0 $2.4 $1.3 $1.5 Commun i ty Broadband National Carrier MSO Inte r nat i on a l Build-to-Print FQ4 18 FQ4 19 63% 14% 10% 8% 5% $7.9 $5.4 $3.8 $51.5 $53.5 $9.1 $11.9 $8.4 $6.5 $4.7 Commun i ty Broadband National Carrier MSO Inte r nat i on a l Build-to-Print 2018 2019 NASDAQ:CLFD 5 Quarterly Revenue Annual Revenue
FieldReport / Fiscal Q4 & Full Year 2019 Earnings Call / November 7 , 2019 Financial Update Dan Herzog CHIEF FINANCIAL OFFICER NASDAQ:CLFD 6
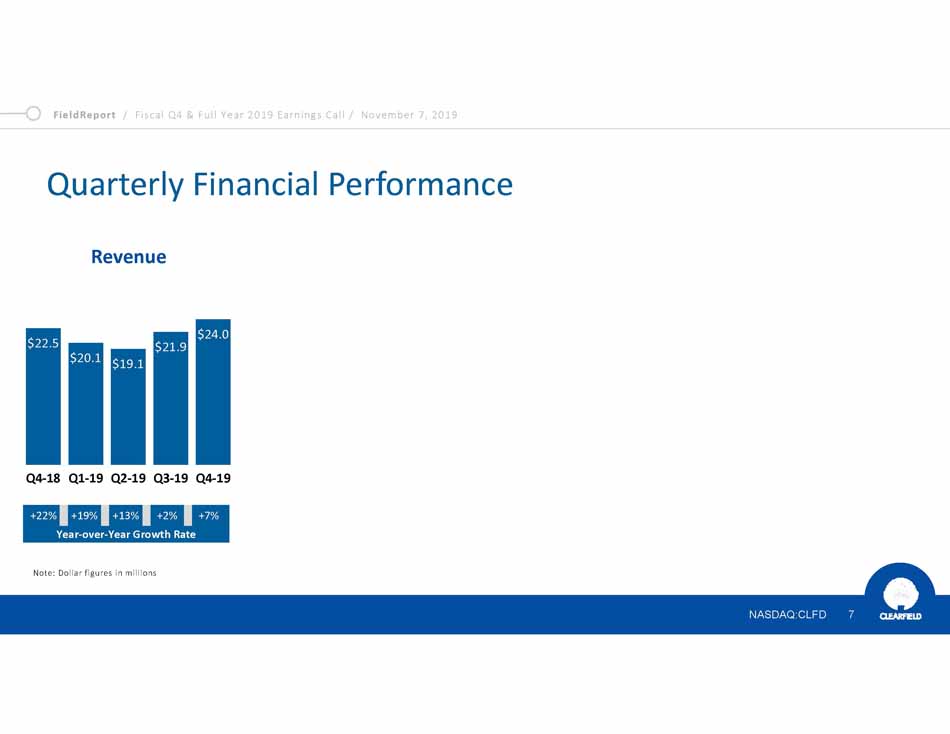
FieldReport / Fiscal Q4 & Full Year 2019 Earnings Call / November 7 , 2019 Quarterly Financial Performance $22.5 NASDAQ:CLFD 7 $20.1 $19.1 $21.9 $24.0 Q4-18 Q1-19 Q2-19 Q3-19 Q4-19 Revenue +22% +19% +13% +2% +7% Year-over-Year Growth Rate Note: Dollar figures in millions
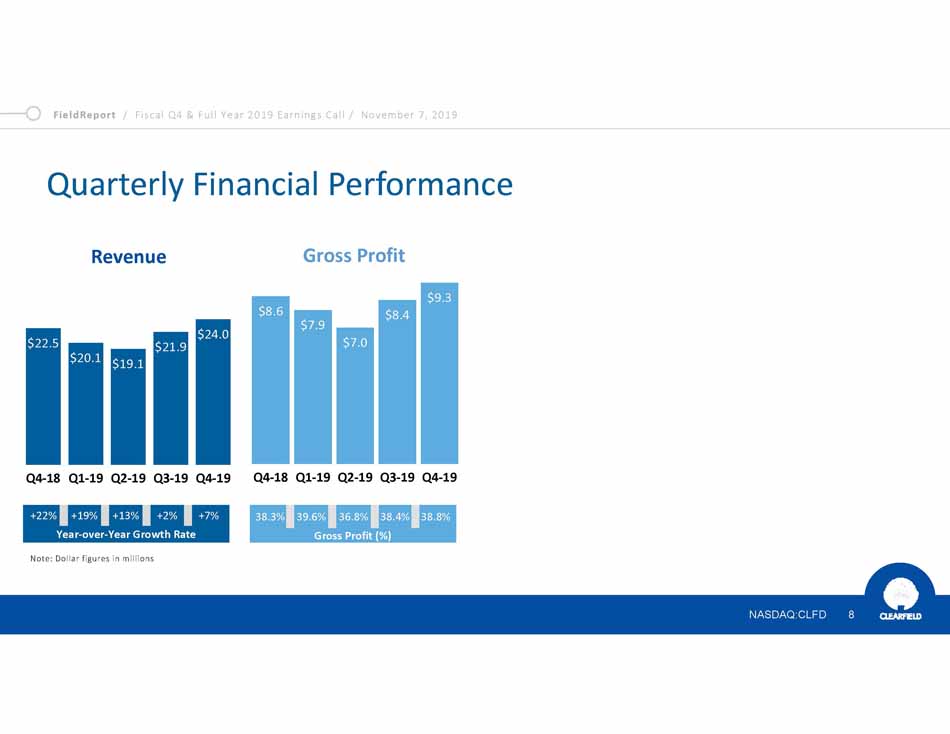
FieldReport / Fiscal Q4 & Full Year 2019 Earnings Call / November 7 , 2019 Quarterly Financial Performance $22.5 $20.1 $19.1 $21.9 $24.0 Q4-18 Q1-19 Q2-19 Q3-19 Q4-19 Revenue +22% +19% +13% +2% +7% Year-over-Year Growth Rate $8.6 NASDAQ:CLFD 8 $7.9 $7.0 $8.4 $9.3 Q4-18 Q1-19 Q2-19 Q3-19 Q4-19 Gross Profit 38.3% 39.6% 36.8% 38.4% 38.8% Gross Profit (%) Note: Dollar figures in millions
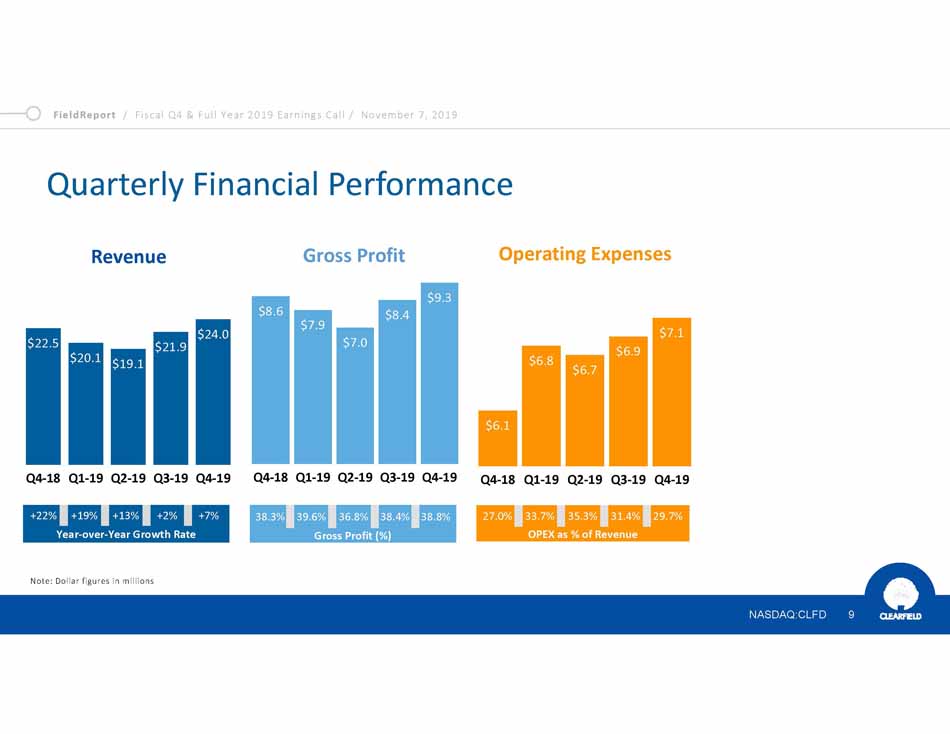
FieldReport / Fiscal Q4 & Full Year 2019 Earnings Call / November 7 , 2019 Quarterly Financial Performance $22.5 $20.1 $19.1 $21.9 $24.0 Q4-18 Q1-19 Q2-19 Q3-19 Q4-19 Revenue +22% +19% +13% +2% +7% Year-over-Year Growth Rate $8.6 NASDAQ:CLFD 9 $7.9 $7.0 $8.4 $9.3 Q4-18 Q1-19 Q2-19 Q3-19 Q4-19 Gross Profit 38.3% 39.6% 36.8% 38.4% 38.8% Gross Profit (%) $7.1 $6.9 $6.8 $6.7 $6.1 Q4-18 Q1-19 Q2-19 Q3-19 Q4-19 Operating Expenses 27.0% 33.7% 35.3% 31.4% 29.7% OPEX as % of Revenue Note: Dollar figures in millions
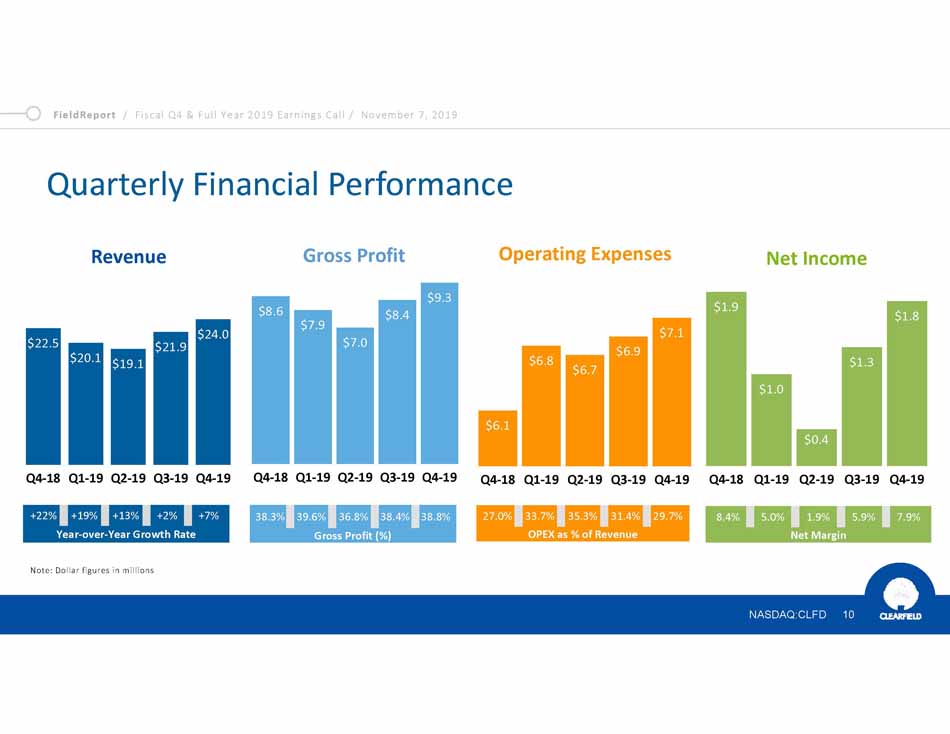
FieldReport / Fiscal Q4 & Full Year 2019 Earnings Call / November 7 , 2019 Quarterly Financial Performance $22.5 $20.1 $19.1 $21.9 $24.0 Q4-18 Q1-19 Q2-19 Q3-19 Q4-19 Revenue +22% +19% +13% +2% +7% Year-over-Year Growth Rate $8.6 $7.9 $7.0 $8.4 $9.3 Q4-18 Q1-19 Q2-19 Q3-19 Q4-19 Gross Profit 38.3% 39.6% 36.8% 38.4% 38.8% Gross Profit (%) $7.1 $6.9 $6.8 $6.7 $6.1 Q4-18 Q1-19 Q2-19 Q3-19 Q4-19 Operating Expenses 27.0% 33.7% 35.3% 31.4% 29.7% OPEX as % of Revenue Note: Dollar figures in millions $1.9 NASDAQ:CLFD 10 $1.0 $0.4 $1.3 $1.8 Q4-18 Q1-19 Q2-19 Q3-19 Q4-19 Net Income 8.4% 5.0% 1.9% 5.9% 7.9% Net Margin
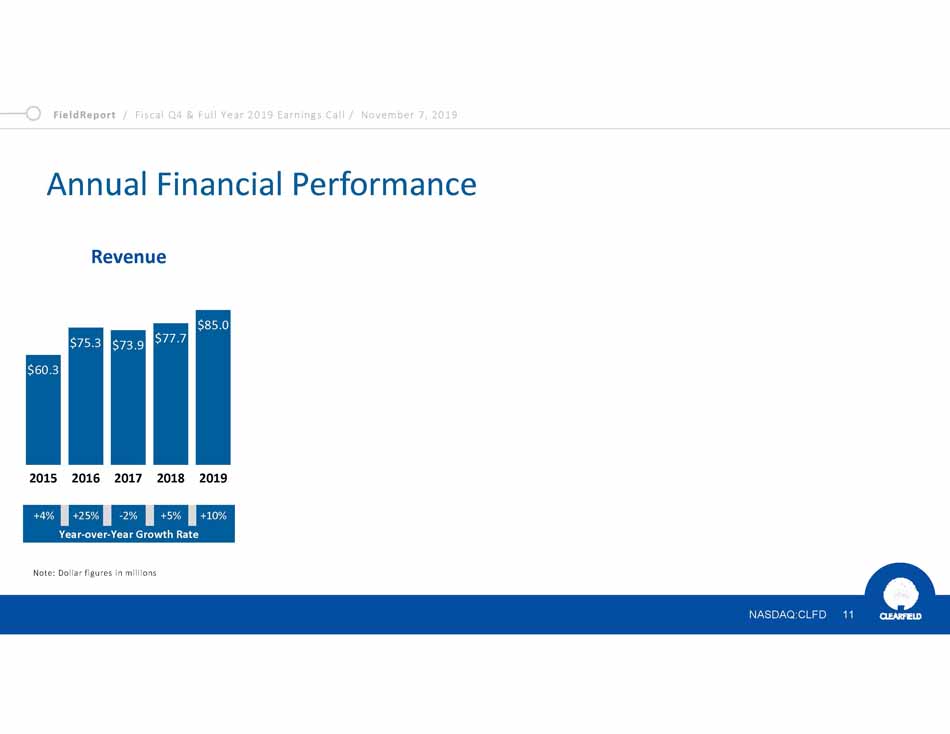
FieldReport / Fiscal Q4 & Full Year 2019 Earnings Call / November 7 , 2019 Annual Financial Performance $60.3 NASDAQ:CLFD 11 $75.3 $73.9 $77.7 $85.0 2 0 15 2 0 16 2 0 17 2 0 18 2 0 19 Revenue +4% +25% -2% +5% +10% Year-over-Year Growth Rate Note: Dollar figures in millions
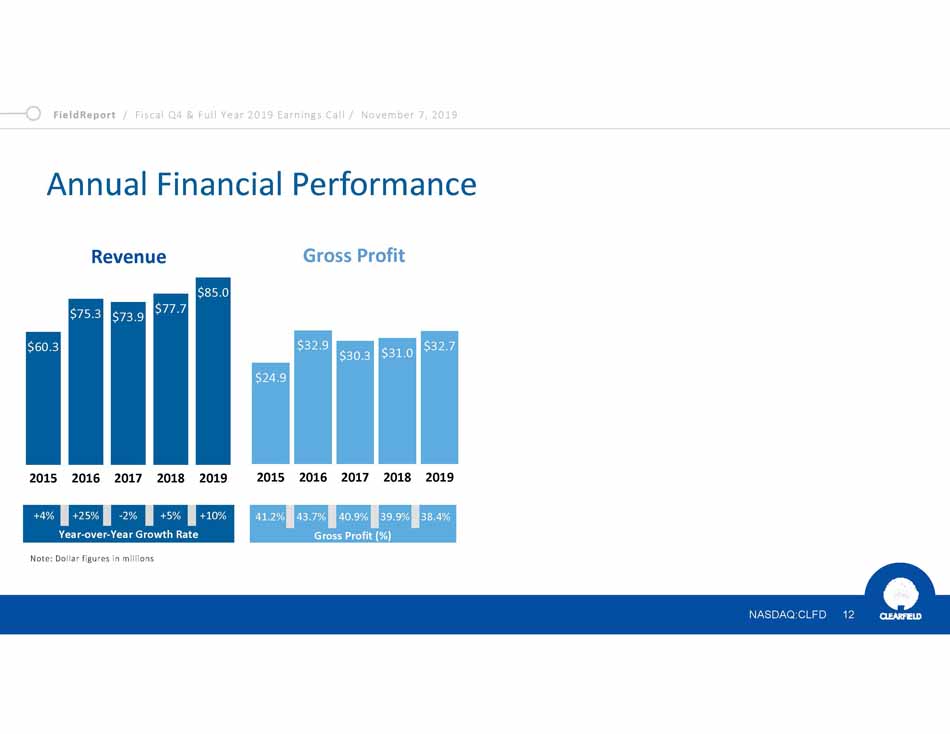
FieldReport / Fiscal Q4 & Full Year 2019 Earnings Call / November 7 , 2019 Annual Financial Performance $32.9 $32.7 $30.3 $31.0 $24.9 2 0 15 2 0 16 2 0 17 2 0 18 2 0 19 Gross Profit 41.2% 43.7% 40.9% 39.9% 38.4% Gross Profit (%) Note: Dollar figures in millions $60.3 NASDAQ:CLFD 12 $75.3 $73.9 $77.7 $85.0 2 0 15 2 0 16 2 0 17 2 0 18 2 0 19 Revenue +4% +25% -2% +5% +10% Year-over-Year Growth Rate
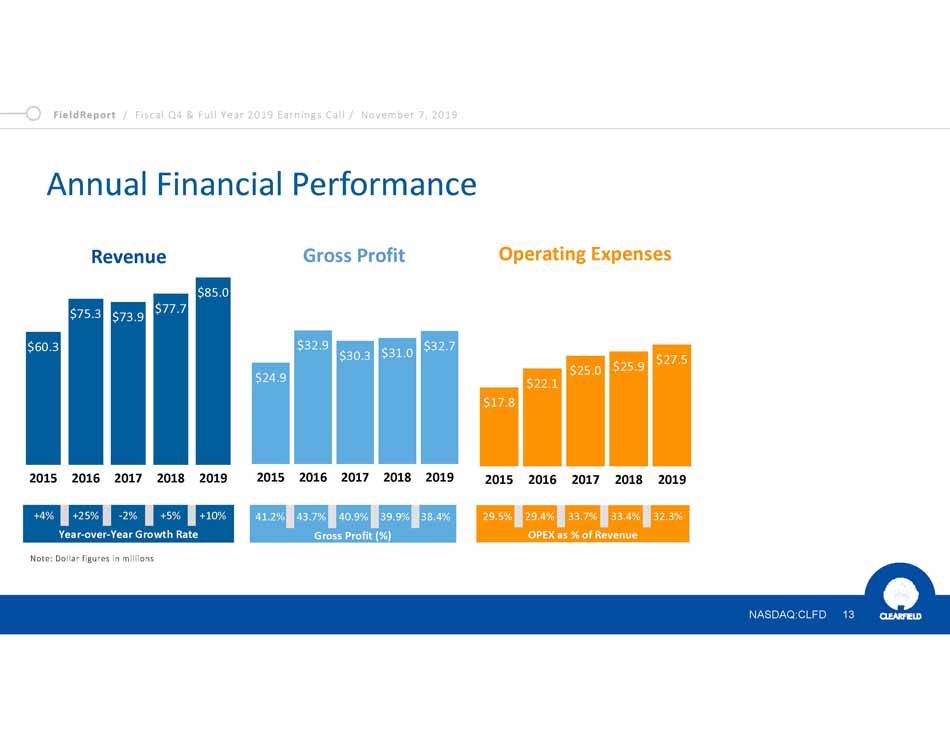
FieldReport / Fiscal Q4 & Full Year 2019 Earnings Call / November 7 , 2019 Annual Financial Performance $32.9 $32.7 $30.3 $31.0 $24.9 2 0 15 2 0 16 2 0 17 2 0 18 2 0 19 Gross Profit 41.2% 43.7% 40.9% 39.9% 38.4% Gross Profit (%) Note: Dollar figures in millions $60.3 NASDAQ:CLFD 13 $75.3 $73.9 $77.7 $85.0 2 0 15 2 0 16 2 0 17 2 0 18 2 0 19 Revenue +4% +25% -2% +5% +10% Year-over-Year Growth Rate $27.5 $25.0 $25.9 $22.1 $17.8 2 0 15 2 0 16 2 0 17 2 0 18 2 0 19 Operating Expenses 29.5% 29.4% 33.7% 33.4% 32.3% OPEX as % of Revenue
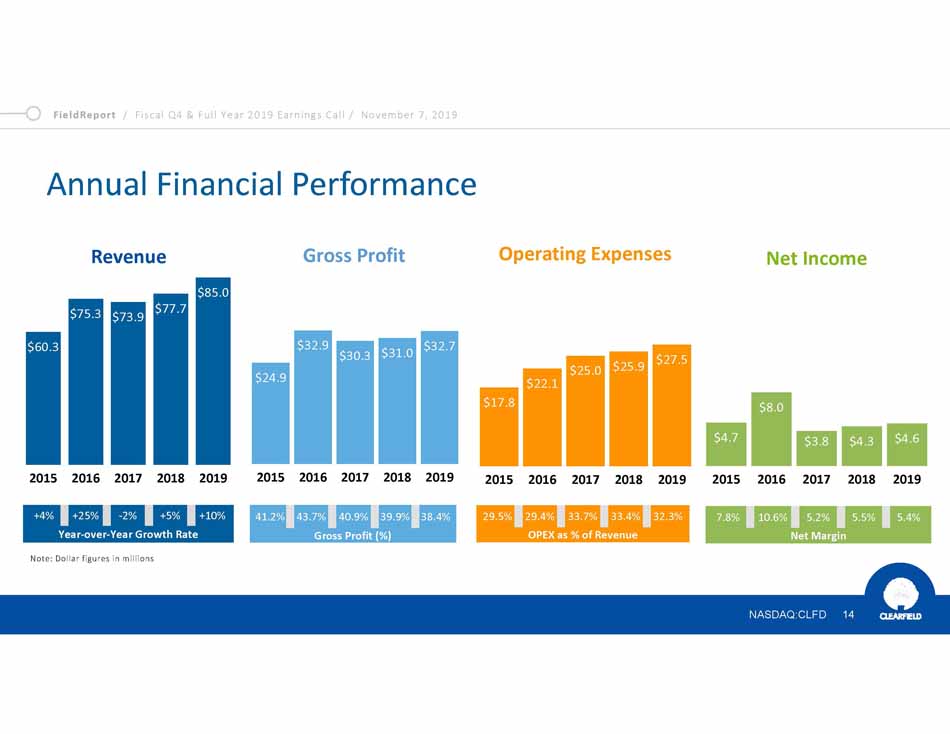
FieldReport / Fiscal Q4 & Full Year 2019 Earnings Call / November 7 , 2019 Annual Financial Performance $32.9 $32.7 $30.3 $31.0 $24.9 2 0 15 2 0 16 2 0 17 2 0 18 2 0 19 Gross Profit 41.2% 43.7% 40.9% 39.9% 38.4% Gross Profit (%) Note: Dollar figures in millions $60.3 NASDAQ:CLFD 14 $75.3 $73.9 $77.7 $85.0 2 0 15 2 0 16 2 0 17 2 0 18 2 0 19 Revenue +4% +25% -2% +5% +10% Year-over-Year Growth Rate $27.5 $25.0 $25.9 $22.1 $17.8 2 0 15 2 0 16 2 0 17 2 0 18 2 0 19 Operating Expenses 29.5% 29.4% 33.7% 33.4% 32.3% OPEX as % of Revenue $8.0 $4.7 $3.8 $4.3 $4.6 2 0 15 2 0 16 2 0 17 2 0 18 2 0 19 Net Income 7.8% 10.6% 5.2% 5.5% 5.4% Net Margin
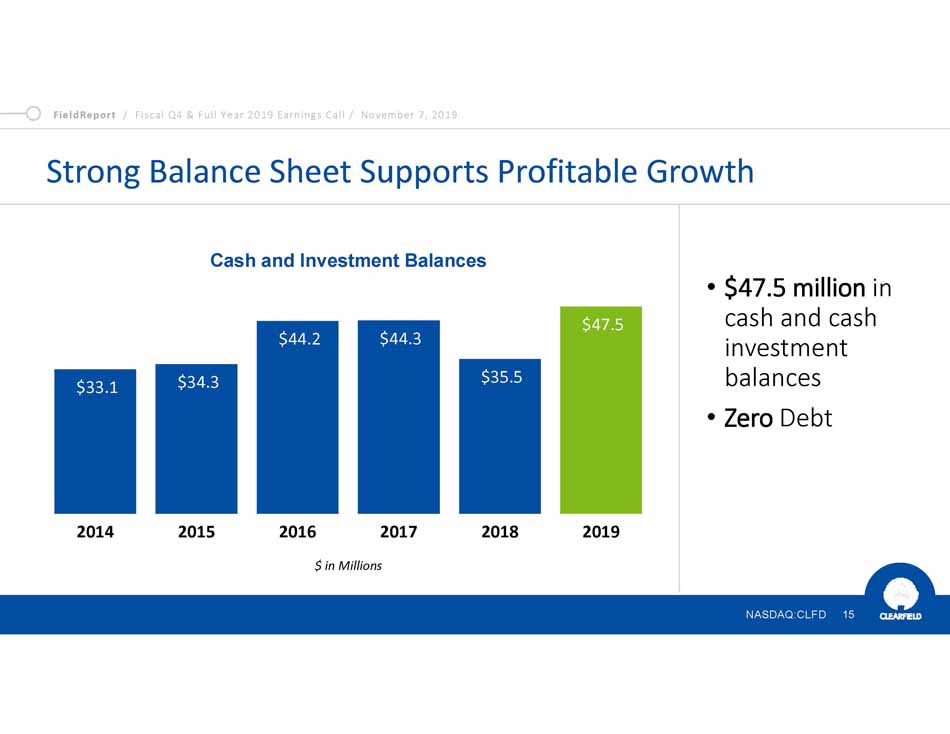
FieldReport / Fiscal Q4 & Full Year 2019 Earnings Call / November 7 , 2019 Strong Balance Sheet Supports Profitable Growth • $47.5 million in cash and cash investment balances • Zero Debt $ in Millions Cash and Investment Balances $33.1 NASDAQ:CLFD 15 $34.3 $44.2 $44.3 $35.5 $47.5 2014 2015 2016 2017 2018 2019
FieldReport / Fiscal Q4 & Full Year 2019 Earnings Call / November 7 , 2019 Clearfield’s ‘Coming of Age’ Plan Expanding Core Community Broadband Business Attracting utilities, co-ops and CLECs as they enter underserved communities, maintaining a steady growth rate NASDAQ:CLFD 16
FieldReport / Fiscal Q4 & Full Year 2019 Earnings Call / November 7 , 2019 Clearfield’s ‘Coming of Age’ Plan Expanding Core Community Broadband Business Attracting utilities, co-ops and CLECs as they enter underserved communities, maintaining a steady growth rate Enhancing Competitive Position and Operational Effectiveness Investing in products, manufacturing and supply chain to increase competitiveness and maintain and reduce costs NASDAQ:CLFD 17
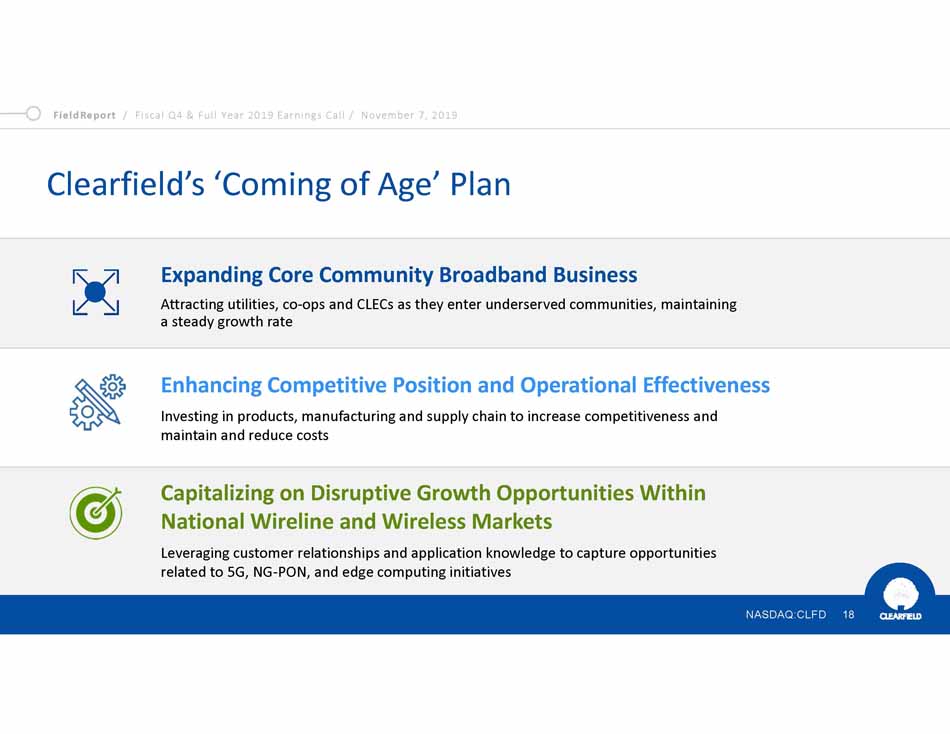
FieldReport / Fiscal Q4 & Full Year 2019 Earnings Call / November 7 , 2019 Clearfield’s ‘Coming of Age’ Plan Expanding Core Community Broadband Business Attracting utilities, co-ops and CLECs as they enter underserved communities, maintaining a steady growth rate Enhancing Competitive Position and Operational Effectiveness Investing in products, manufacturing and supply chain to increase competitiveness and maintain and reduce costs Capitalizing on Disruptive Growth Opportunities Within National Wireline and Wireless Markets Leveraging customer relationships and application knowledge to capture opportunities related to 5G, NG-PON, and edge computing initiatives NASDAQ:CLFD 18
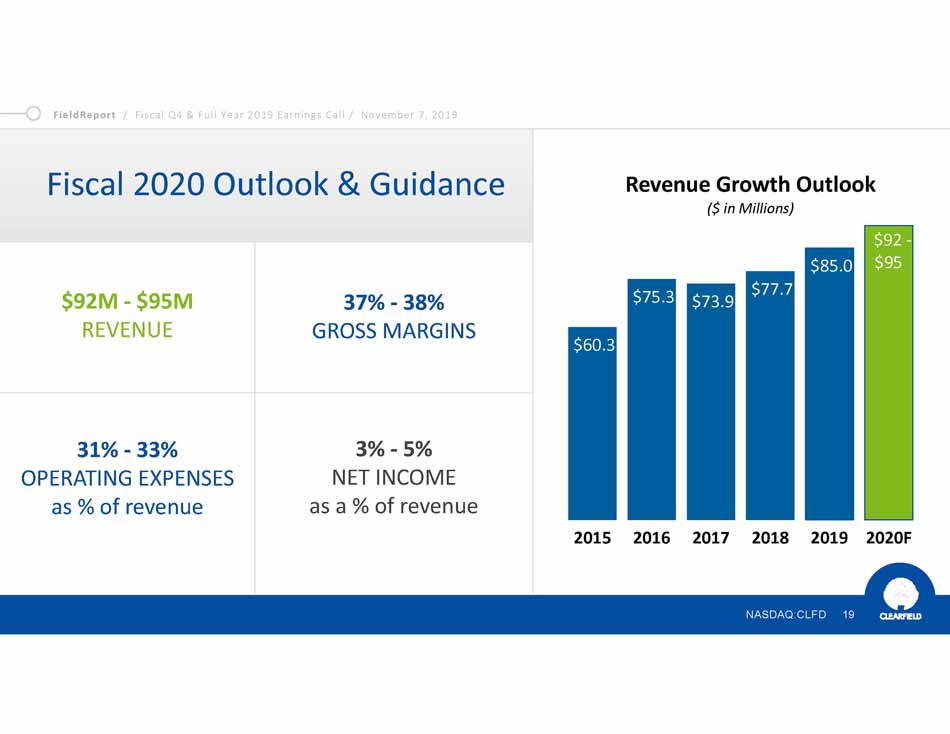
FieldReport / Fiscal Q4 & Full Year 2019 Earnings Call / November 7 , 2019 Fiscal 2020 Outlook & Guidance $92M - $95M REVENUE $60.3 $75.3 $73.9 $77.7 $85.0 $92 - $95 201 5 201 6 201 7 201 8 201 9 2020F Revenue Growth Outlook ($ in Millions) 37% - 38% GROSS MARGINS 31% - 33% OPERATING EXPENSES as % of revenue 3% - 5% NET INCOME as a % of revenue NASDAQ:CLFD 19

FieldReport / Fiscal Q4 & Full Year 2019 Earnings Call / November 7 , 2019 Q&A Cheri Beranek PRESIDENT & CEO Dan Herzog CHIEF FINANCIAL OFFICER NASDAQ:CLFD 20