
Exhibit 99.2
Clearfield Earnings Presentation: Fiscal Q2 2023 Earnings Call May 4, 2023 1
Important Cautions Regarding Forward - Looking Statements 2 Forward - looking statements contained herein and in any related presentation or in the related Earnings Release are made pursuant to the safe harbor provisions of the Private Litigation Reform Act of 1995. Words such as “may,” “will,” “expect,” “believe,” “anticipate,” “estimate,” “outlook,” or “continue” or comparab le terminology are intended to identify forward - looking statements. Such forward looking statements include, for example, statements about the Company’s future revenue and operating performance , a nticipated shipping on backlog and future lead times, future availability of components and materials from the Company’s supply chain, future availability of labor impacting our c ust omers’ network builds, the impact of the Rural Digital Opportunity Fund (RDOF) or other government programs on the demand for the Company’s products or timing of customer orders, the Company’s ab ility to add capacity to meet expected future demand, and trends in and growth of the FTTx markets, market segments or customer purchases and other statements that are not historical facts. These statements are based u pon the Company's current expectations and judgments about future developments in the Company's business. Certain important factors could have a m aterial impact on the Company's performance, including, without limitation: the COVID - 19 pandemic has significantly impacted worldwide economic conditions and could have a material adv erse effect on our business, financial condition and operating results; inflationary price pressures and uncertain availability of components, raw materials, labor and logistics used by us an d our suppliers could negatively impact our profitability; we rely on single - source suppliers, which could cause delays, increase costs or prevent us from completing customer orders; we depend on th e availability of sufficient supply of certain materials and global disruptions in the supply chain for these materials could prevent us from meeting customer demand for our products; we rely o n o ur manufacturing operations to produce product to ship to customers and manufacturing constraints and disruptions could result in decreased future revenue; a significant percentage of ou r sales in the last three fiscal years have been made to a small number of customers, and the loss of these major customers could adversely affect us; further consolidation among our custome rs may result in the loss of some customers and may reduce sales during the pendency of business combinations and related integration activities; we may be subject to risks associated wit h acquisitions, and the risks could adversely affect future operating results; we have exposure to movements in foreign currency exchange rates; if we are unable to integrate acquired b usi nesses, our financial results could be materially and adversely affected; adverse global economic conditions and geopolitical issues could have a negative effect on our business, and result s o f operations and financial condition; our planned growth may strain our business infrastructure, which could adversely affect our operations and financial condition; product defects or t he failure of our products to meet specifications could cause us to lose customers and sales or to incur unexpected expenses; we are dependent on key personnel; cyber - security incidents on our informat ion technology systems, including ransomware, data breaches or computer viruses, could disrupt our business operations, damage our reputation, and potentially lead to litigatio n; our business is dependent on interdependent management information systems; to compete effectively, we must continually improve existing products and introduce new products that ac hie ve market acceptance; if the telecommunications market does not continue to expand, our business may not grow as fast as we expect, which could adversely impact our business, financial con dition and operating results; changes in U.S. government funding programs may cause our customers and prospective customers to delay, reduce, or accelerate purchases, leading to unpr edi ctable and irregular purchase cycles; intense competition in our industry may result in price reductions, lower gross profits and loss of market share; our success depends upon adequate pro tection of our patent and intellectual property rights; we face risks associated with expanding our sales outside of the United States; and other factors set forth in Part I, Item IA. Risk Fac tors of Clearfield's Annual Report on Form 10 - K for the year ended September 30, 2022 as well as other filings with the Securities and Exchange Commission. The Company undertakes no obligation to update these statements to reflect actual events unless required by law. © Copyright 2023 Clearfield, Inc. All Rights Reserved.

3 Introduction & Highlights
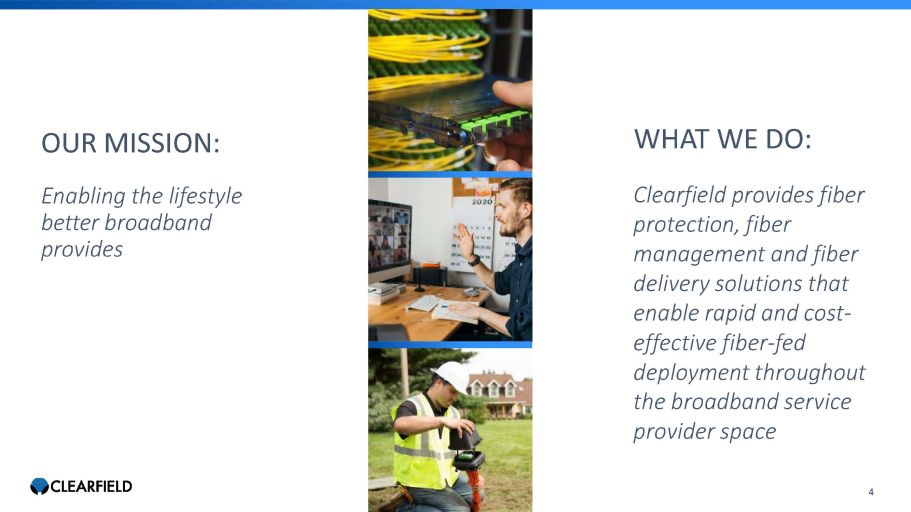
OUR MISSION: Enabling the l ifestyle b etter b roadband p rovides WHAT WE DO : Clearfield provides fiber protection, fiber management and fiber delivery solutions that enable rapid and cost - effective fiber - fed deployment throughout the broadband service provider space 4
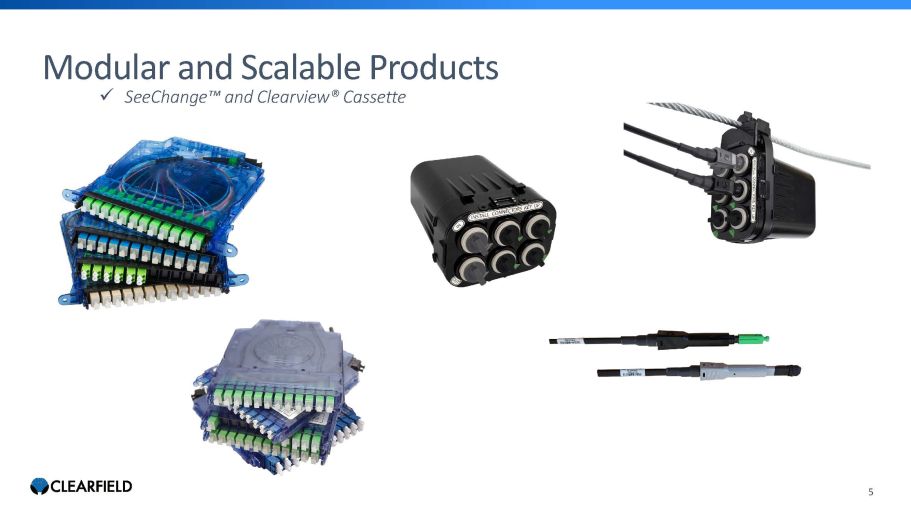
NASDAQ:CLFD x SeeChange Ρ and Clearview® Cassette 5 Modular and Scalable Products
Providing Optimized Price Performance and Deep Technical Expertise NASDAQ:CLFD x Singularly Focused on Serving the Fiber Market x Attractive Total Cost of Ownership through Reduced Installation Cost and Maintenance Time x Our Testing Shows FastPass TM Approach Cuts Install Time Required for Homes Passed by 50% x Ease, Speed, and Cost of Deployment x Delivery of a Comprehensive Solution x Commitment to Quality and Customers x Acquisition of Nestor Cables Highlights Investment to Integrate and Optimize Solutions and Mitigate Supply Chain Risk 6 Why We Win
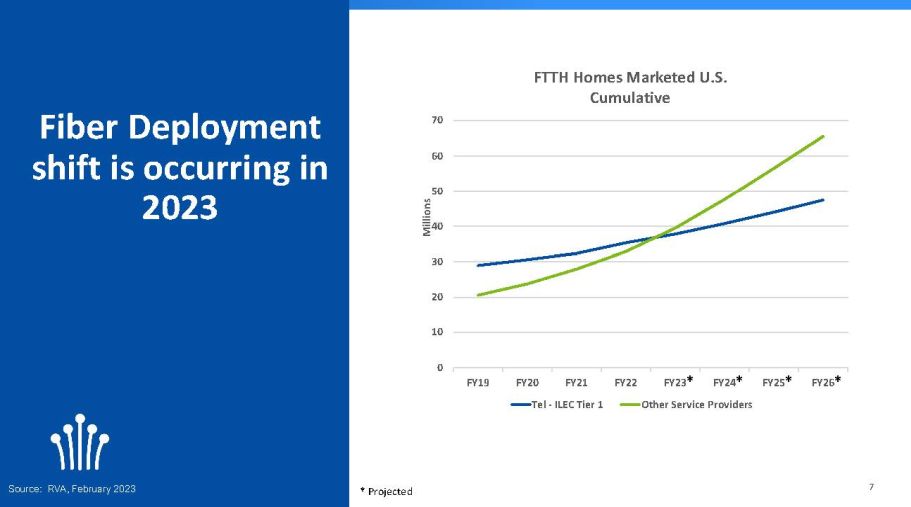
Fiber Deployment shift is occurring in 2023 Source: RVA, February 2023 Proprietary & Confidential 7 0 10 20 30 40 50 60 70 FY19 FY20 FY21 FY22 FY23 FY24 FY25 FY26 Millions FTTH Homes Marketed U.S. Cumulative Tel - ILEC Tier 1 Other Service Providers 7 * * * * * Projected
8 Financial Performance
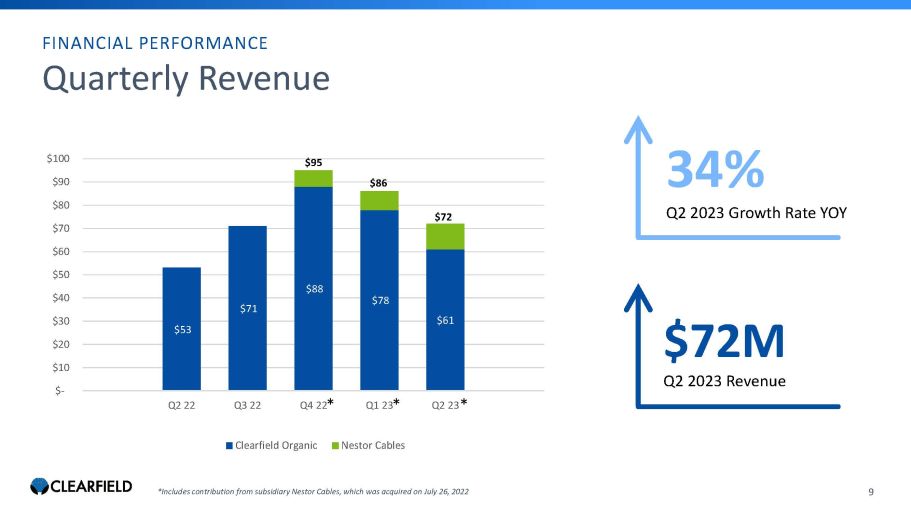
Quarterly Revenue $53 $71 $88 $78 $61 $- $10 $20 $30 $40 $50 $60 $70 $80 $90 $100 Q2 22 Q3 22 Q4 22 Q1 23 Q2 23 Clearfield Organic Nestor Cables * * * FINANCIAL PERFORMANCE 34 % Q2 2023 Growth Rate YO Y $72M Q2 2023 Revenue 9 $95 $ 86 $72 *Includes contribution from subsidiary Nestor Cables, which was acquired on July 26, 2022
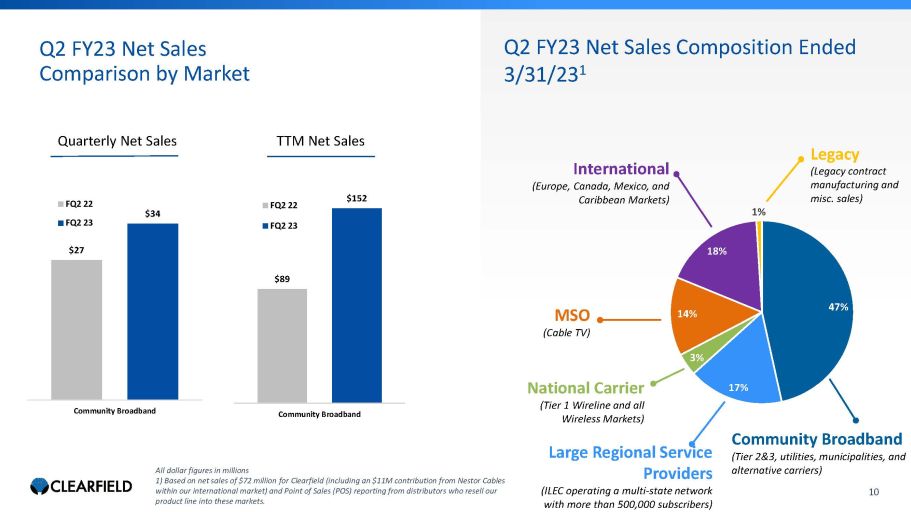
Q2 FY23 Net Sales Comparison by Market NASDAQ:CLFD All dollar figures in millions 1) Based on net sales of $72 million for Clearfield (including an $11M contribution from Nestor Cables within our international market) and Point of Sales (POS) reporting from distributors who resell our product line into these markets. Q2 FY23 Net Sales Composition Ended 3 /31/23 1 Legacy (Legacy contract manufacturing and misc. sales) 47% 17% 3% 14% 18% 1% $89 $152 Community Broadband FQ2 22 FQ2 23 Quarterly Net Sales TTM Net Sales Community Broadband (Tier 2&3, utilities, municipalities, and alternative carriers) MSO (Cable TV) International (Europe, Canada, Mexico, and Caribbean Markets) 10 $27 $34 Community Broadband FQ2 22 FQ2 23 National Carrier (Tier 1 Wireline and all Wireless Markets) Large Regional Service Providers (ILEC operating a multi - state network with more than 500,000 subscribers)
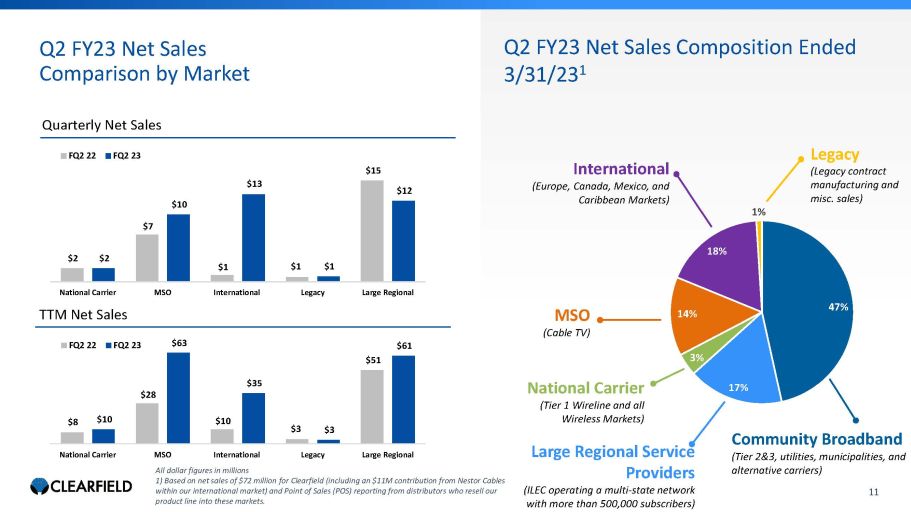
NASDAQ:CLFD $8 $28 $10 $3 $51 $10 $63 $35 $3 $61 National Carrier MSO International Legacy Large Regional FQ2 22 FQ2 23 $2 $7 $1 $1 $15 $2 $10 $13 $1 $12 National Carrier MSO International Legacy Large Regional FQ2 22 FQ2 23 Q2 FY23 Net Sales Comparison by Market Quarterly Net Sales TTM Net Sales All dollar figures in millions 1) Based on net sales of $72 million for Clearfield (including an $11M contribution from Nestor Cables within our international market) and Point of Sales (POS) reporting from distributors who resell our product line into these markets. Q2 FY23 Net Sales Composition Ended 3 /31/23 1 Legacy (Legacy contract manufacturing and misc. sales) 47% 17% 3% 14% 18% 1% Community Broadband (Tier 2&3, utilities, municipalities, and alternative carriers) MSO (Cable TV) International (Europe, Canada, Mexico, and Caribbean Markets) 11 National Carrier (Tier 1 Wireline and all Wireless Markets) Large Regional Service Providers (ILEC operating a multi - state network with more than 500,000 subscribers)
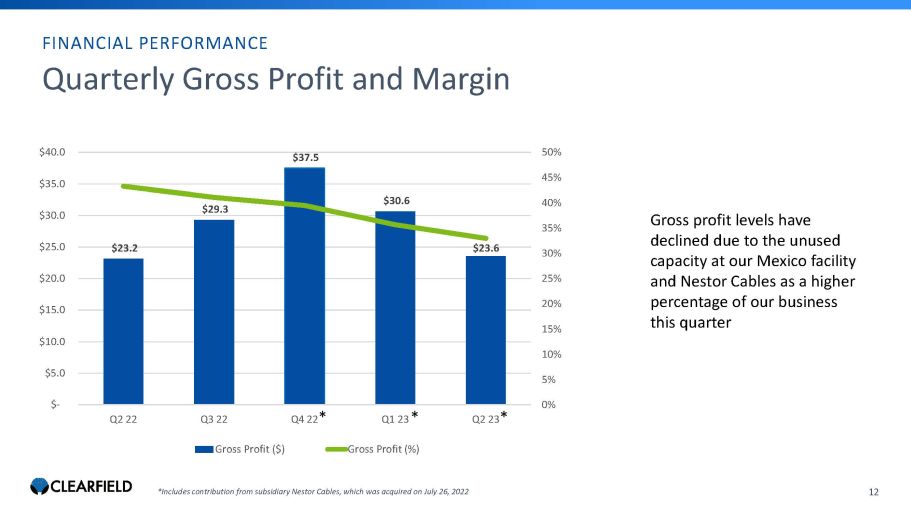
Quarterly Gross Profit and Margin $23.2 $29.3 $37.5 $30.6 $23.6 0% 5% 10% 15% 20% 25% 30% 35% 40% 45% 50% $- $5.0 $10.0 $15.0 $20.0 $25.0 $30.0 $35.0 $40.0 Q2 22 Q3 22 Q4 22 Q1 23 Q2 23 Gross Profit ($) Gross Profit (%) FINANCIAL PERFORMANCE 12 Gross profit levels have declined due to the unused capacity at our Mexico facility and Nestor Cables as a higher percentage of our business this quarter * *Includes contribution from subsidiary Nestor Cables, which was acquired on July 26, 2022 * *
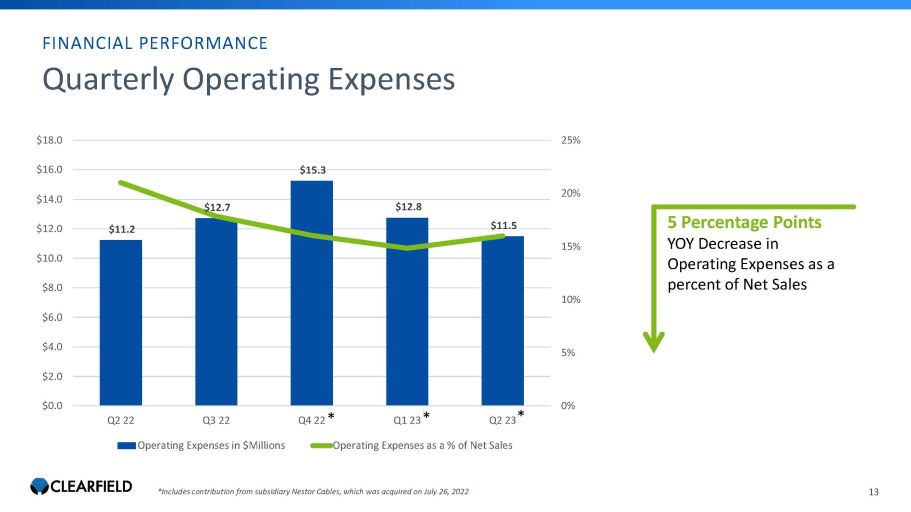
$11.2 $12.7 $15.3 $12.8 $11.5 0% 5% 10% 15% 20% 25% $0.0 $2.0 $4.0 $6.0 $8.0 $10.0 $12.0 $14.0 $16.0 $18.0 Q2 22 Q3 22 Q4 22 Q1 23 Q2 23 Operating Expenses in $Millions Operating Expenses as a % of Net Sales * * * FINANCIAL PERFORMANCE 5 Percentage Points YOY Decrease in Operating Expenses as a percent of Net Sales 13 Quarterly Operating Expenses *Includes contribution from subsidiary Nestor Cables, which was acquired on July 26, 2022
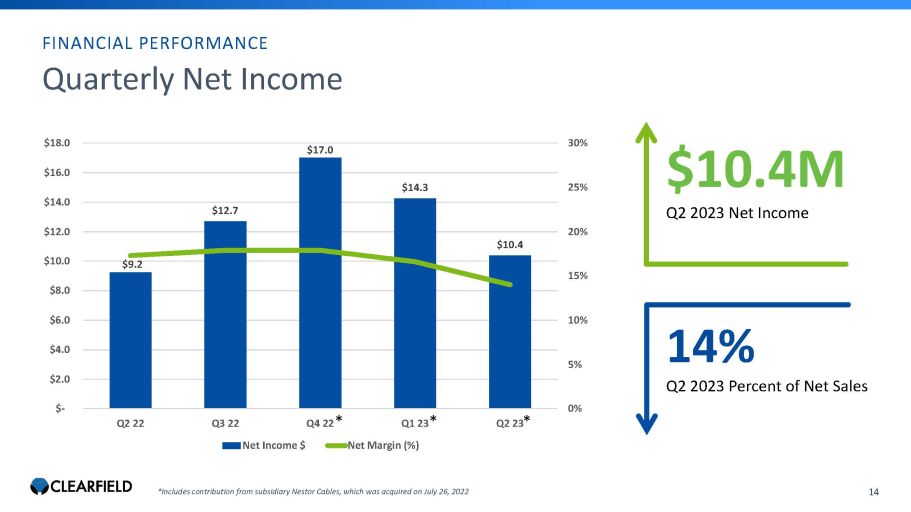
$9.2 $12.7 $17.0 $14.3 $10.4 0% 5% 10% 15% 20% 25% 30% $- $2.0 $4.0 $6.0 $8.0 $10.0 $12.0 $14.0 $16.0 $18.0 Q2 22 Q3 22 Q4 22 Q1 23 Q2 23 Net Income $ Net Margin (%) * * * $ 10.4 M Q2 2023 Net Income 14% Q2 2023 Percent of Net Sales FINANCIAL PERFORMANCE 14 Quarterly Net Income *Includes contribution from subsidiary Nestor Cables, which was acquired on July 26, 2022
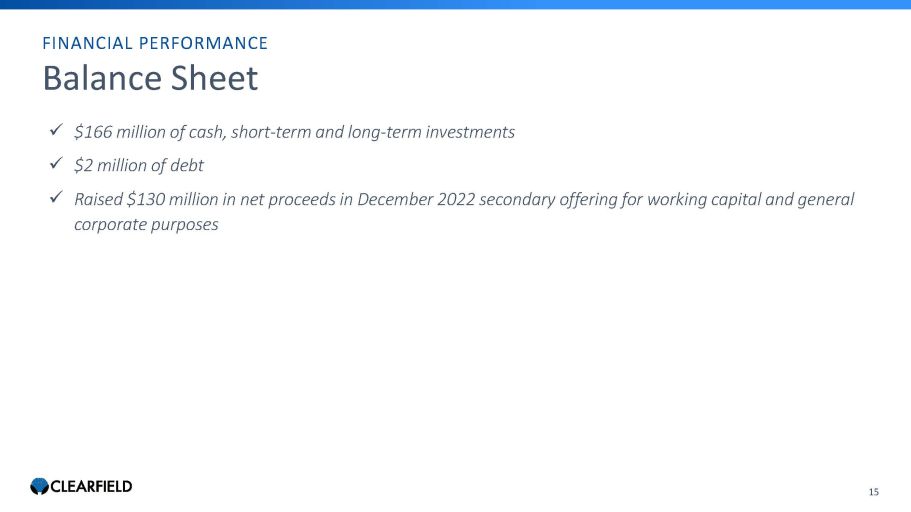
Balance Sheet FINANCIAL PERFORMANCE 15 x $166 million of cash, short - term and long - term investments x $2 million of debt x Raised $130 million in net proceeds in December 2022 secondary offering for working capital and general corporate purposes

16 Business Update & Outlook
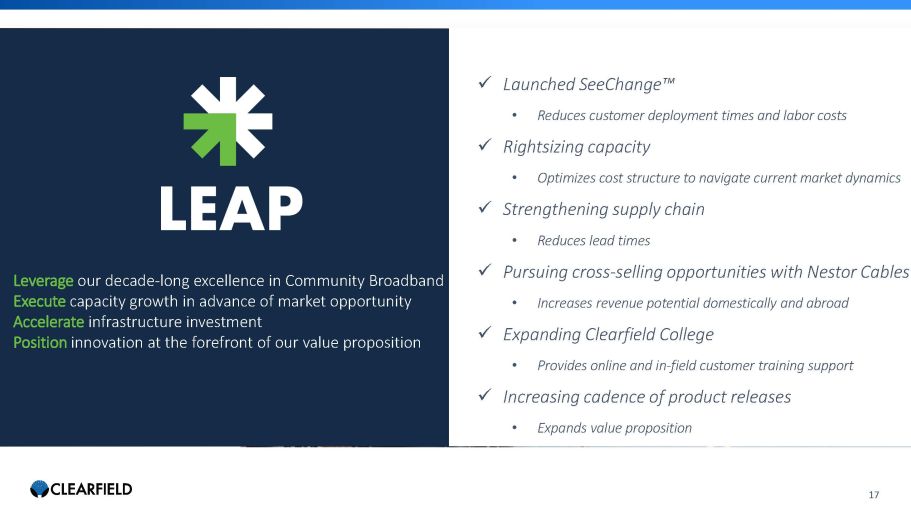
17 Leverage our decade - long excellence in Community Broadband Execute capacity growth in advance of market opportunity Accelerate infrastructure investment Position innovation at the forefront of our value proposition x Launched SeeChange Ρ • Reduces customer deployment times and labor costs x Rightsizing capacity • Optimizes cost structure to navigate current market dynamics x Strengthening supply chain • Reduces lead times x Pursuing cross - selling opportunities with Nestor Cables • Increases revenue potential domestically and abroad x Expanding Clearfield College • Provides online and in - field customer training support x Increasing cadence of product releases • Expands value proposition
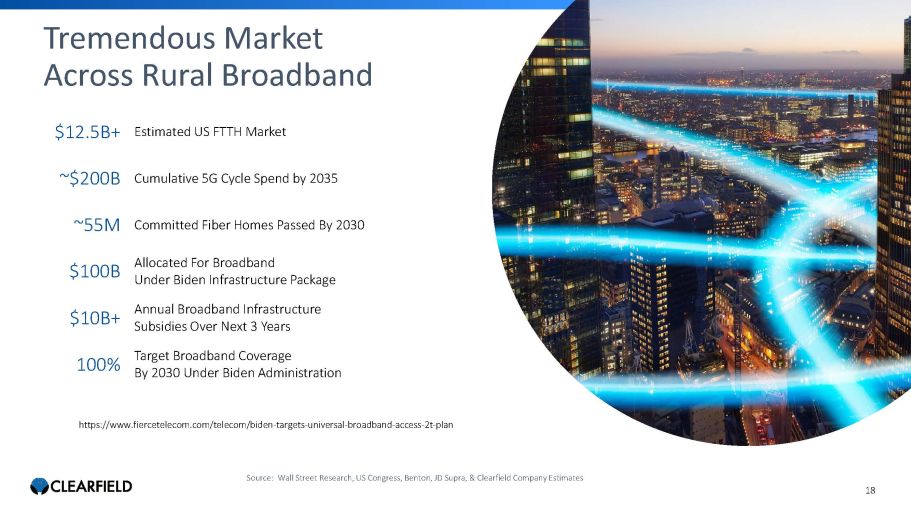
Estimated US FTTH Market $12.5B+ Cumulative 5G Cycle Spend by 2035 ~$200B Committed Fiber Homes Passed By 2030 ~55M Allocated For Broadband Under Biden Infrastructure Package $100B Annual Broadband Infrastructure Subsidies Over Next 3 Years $10B+ Target Broadband Coverage By 2030 Under Biden Administration 100% Tremendous Market Across Rural Broadband Source: Wall Street Research, US Congress, Benton, JD Supra, & Clearfield Company Estimates 18 https:// www.fiercetelecom.com /telecom/biden - targets - universal - broadband - access - 2t - plan

NASDAQ:CLFD x Government Funding for unserved and underserved communities x European Expansion x 5G: Wireless and Wireline Integration x Cloud, Edge and IoT Architecture 19 Long - term Catalysts
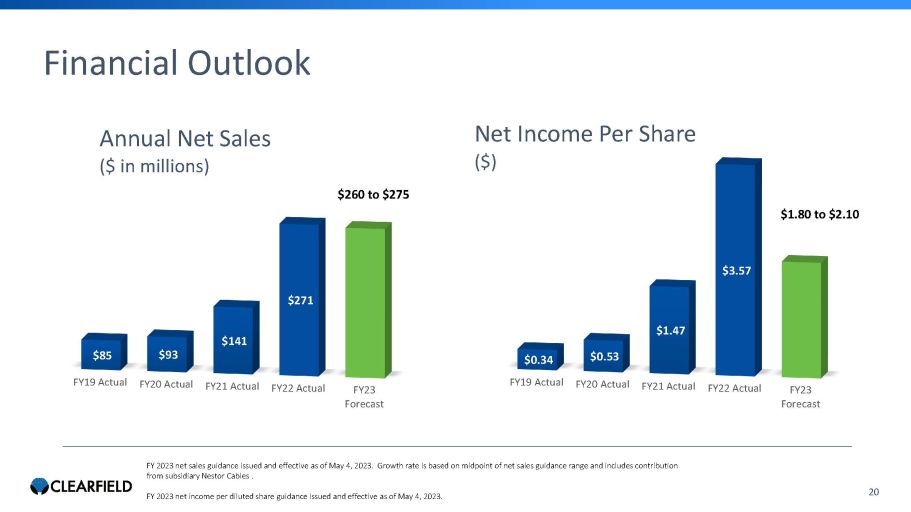
FY19 Actual FY20 Actual FY21 Actual FY22 Actual FY23 Forecast $85 $93 $141 $271 $260 to $275 NASDAQ:CLFD FY 2023 net sales guidance issued and effective as of May 4, 2023. Growth rate is based on midpoint of net sales guidance ra nge and includes contribution from subsidiary Nestor Cables . FY 2023 net income per diluted share guidance issued and effective as of May 4, 2023. Annual Net Sales ($ in millions) 20 Financial Outlook $380 - $393 FY19 Actual FY20 Actual FY21 Actual FY22 Actual FY23 Forecast $0.34 $0.53 $1.47 $3.57 $1.80 to $2.10 Net Income Per Share ($)

Cheri Beranek PRESIDENT & CEO Dan Herzog CHIEF FINANCIAL OFFICER Q&A 21 Kevin Morgan CHIEF MARKETING OFFICER
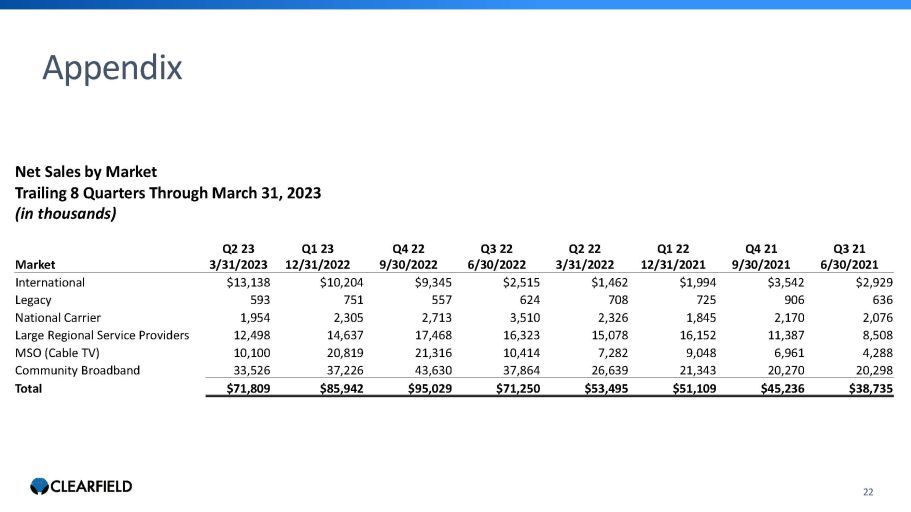
NASDAQ:CLFD 22 Appendix Net Sales by Market Trailing 8 Quarters Through March 31, 2023 (in thousands) Q3 21 6/30/2021 Q4 21 9/30/2021 Q1 22 12/31/2021 Q2 22 3/31/2022 Q3 22 6/30/2022 Q4 22 9/30/2022 Q1 23 12/31/2022 Q2 23 3/31/2023 Market $2,929 $3,542 $1,994 $1,462 $2,515 $9,345 $10,204 $13,138 International 636 906 725 708 624 557 751 593 Legacy 2,076 2,170 1,845 2,326 3,510 2,713 2,305 1,954 National Carrier 8,508 11,387 16,152 15,078 16,323 17,468 14,637 12,498 Large Regional Service Providers 4,288 6,961 9,048 7,282 10,414 21,316 20,819 10,100 MSO (Cable TV) 20,298 20,270 21,343 26,639 37,864 43,630 37,226 33,526 Community Broadband $38,735 $45,236 $51,109 $53,495 $71,250 $95,029 $85,942 $71,809 Total
23 Contact Us COMPANY CONTACT: Cheri Beranek President & CEO Clearfield, Inc. IR@seeclearfield.com INVESTOR RELATIONS: The Blueshirt Group Greg McNiff T: 773 - 485 - 7191 clearfield@blueshirtgroup.com