
Exhibit 99.1
Clearfield Earnings Presentation: Fiscal Q2 2023 Earnings Call May 4, 2023 1 1
Important Cautions Regarding Forward - Looking Statements Forward - looking statements contained herein and in any related presentation or in the related Earnings Release are made pursuant to the safe harbor provisions of the Private Litigation Reform Act of 1995. Words such as “may,” “will,” “expect,” “believe,” “anticipate,” “estimate,” “outlook,” or “continue” or comparable terminology are intended to identify forward - looking statements. Such forward looking statements include, for example, statements about the Company’s future revenue and operating performance, anticipated shipping on backlog and future lead times, future availability of components and materials from the Company’s supply chain, future availability of labor impacting our customers’ network builds, the impact of the Rural Digital Opportunity Fund (RDOF) or other government programs on the demand for the Company’s products or timing of customer orders, the Company’s ability to add capacity to meet expected future demand, and trends in and growth of the FTTx markets, market segments or customer purchases and other statements that are not historical facts. These statements are based upon the Company's current expectations and judgments about future developments in the Company's business. Certain important factors could have a material impact on the Company's performance, including, without limitation: the COVID - 19 pandemic has significantly impacted worldwide economic conditions and could have a material adverse effect on our business, financial condition and operating results; inflationary price pressures and uncertain availability of components, raw materials, labor and logistics used by us and our suppliers could negatively impact our profitability; we rely on single - source suppliers, which could cause delays, increase costs or prevent us from completing customer orders; we depend on the availability of sufficient supply of certain materials and global disruptions in the supply chain for these materials could prevent us from meeting customer demand for our products; we rely on our manufacturing operations to produce product to ship to customers and manufacturing constraints and disruptions could result in decreased future revenue; a significant percentage of our sales in the last three fiscal years have been made to a small number of customers, and the loss of these major customers could adversely affect us; further consolidation among our customers may result in the loss of some customers and may reduce sales during the pendency of business combinations and related integration activities; we may be subject to risks associated with acquisitions, and the risks could adversely affect future operating results; we have exposure to movements in foreign currency exchange rates; if we are unable to integrate acquired businesses, our financial results could be materially and adversely affected; adverse global economic conditions and geopolitical issues could have a negative effect on our business, and results of operations and financial condition; our planned growth may strain our business infrastructure, which could adversely affect our operations and financial condition; product defects or the failure of our products to meet specifications could cause us to lose customers and sales or to incur unexpected expenses; we are dependent on key personnel; cyber - security incidents on our information technology systems, including ransomware, data breaches or computer viruses, could disrupt our business operations, damage our reputation, and potentially lead to litigation; our business is dependent on interdependent management information systems; to compete effectively, we must continually improve existing products and introduce new products that achieve market acceptance; if the telecommunications market does not continue to expand, our business may not grow as fast as we expect, which could adversely impact our business, financial condition and operating results; changes in U.S. government funding programs may cause our customers and prospective customers to delay, reduce, or accelerate purchases, leading to unpredictable and irregular purchase cycles; intense competition in our industry may result in price reductions, lower gross profits and loss of market share; our success depends upon adequate protection of our patent and intellectual property rights; we face risks associated with expanding our sales outside of the United States; and other factors set forth in Part I, Item IA. Risk Factors of Clearfield's Annual Report on Form 10 - K for the year ended September 30, 2022 as well as other filings with the Securities and Exchange Commission. The Company undertakes no obligation to update these statements to reflect actual events unless required by law. © Copyright 2023 Clearfield, Inc. All Rights Reserved. 2 2 Thank you. Joining me on the call today are Cheri Beranek, Clearfield’s President and CEO, Dan Herzog, Clearfield’s CFO and Kevin Morgan, Clearfield’s CMO. Please note that during this call, management will be making remarks regarding future events and the future financial performance of the Company. These remarks constitute forward looking statements for purposes of the safe harbor provisions of the Private Securities Litigation Reform Act. These forward - looking statements are subject to risks and uncertainties that could cause actual results to differ materially from those in the forward - looking statements. It is important to note also that the Company undertakes no obligation to update such statements, except as required by law. The Company cautions you to consider risk factors that could cause actual results to differ materially from those in the Forward - Looking Statements contained in today’s press release, earnings presentation, and in this conference call. The Risk Factors section in Clearfield’s most recent Form 10 - K filing with the Securities and Exchange Commission and its subsequent filings on Form 10 - Q, provide a description of those risks. With that, I would like to turn the call over to Clearfield’s President and CEO, Cheri Beranek. Cheri.
3 Introduction & Highlights Good afternoon everyone, and thank you for joining us today to discuss Clearfield’s results for the second quarter of fiscal 2023. We will also provide an update on our business and current market trends. Before I review our performance and current market dynamics, I want to emphasize that we remain more confident than ever that the long - term demand for fiber broadband remains exceptionally strong as the superiority of fiber as both a technology and an investment is well established. Accordingly, we are focused on positioning the company to capture market share once industry ordering patterns return to more normalized levels. I’ll discuss these initiatives in more detail shortly. Clearfield has always differentiated itself on its crisp execution. As demand increased throughout the pandemic, Clearfield was able to respond quickly, driving revenue beyond 40% growth for the previous 9 quarters. Moreover, our execution allowed us to move into larger accounts and take share as demand for hardware intensified. We intend to remain focused on execution as the industry works through the near - term dynamics and prepares for the return to growth led by significant government funding initiatives. Our second quarter fiscal 2023 revenue and net income per share came in relatively in line with our forecast for the quarter. Total net sales for the second quarter were $72 million, which includes an $11 million contribution from Nestor Cables. However, following our first quarter report, what we originally thought was a transition to a more normalized, seasonally driven ordering and deployment pattern by some of our customers has developed into a much more significant lull in demand as inventory is digested. Specifically, we have experienced order pushouts by several Large Regional Service Providers and some Multiple System Operators (“MSO” or Cable TV providers) who had accumulated an excess inventory position during the pandemic period. In light of this inventory digestion, we expect revenue to be lower than we previously anticipated. Accordingly, we are updating our revenue guidance for fiscal year 2023. We now expect revenue for the full year to be in the range of $260 to $275 million. Additionally, we are updating our 2023 net income per share guidance. We now expect net income per diluted share to be in the range of $1.80 to $2.10. The majority of this downward revision to guidance is due to a pause in orders at the Large Regional Service Providers and to a lesser extent, the MSOs. Of the approximately $120 million in revenue reduction at the mid - point of guidance, a significant portion was due to pushouts in orders while the remainder was due to an inventory overhang related to purchases during the pandemic. 3
OUR MISSION: Enabling the lifestyle better broadband provides WHAT WE DO: Clearfield provides fiber protection, fiber management and fiber delivery solutions that enable rapid and cost - effective fiber - fed deployment throughout the broadband service provider space 4 As we discussed on our previous earnings call, throughout the pandemic our customers ordered products early in their deployment schedules to stay ahead of any supply chain challenges. This “just - in - case” approach, particularly at our Large Regional Service Providers, led to growth in our backlog, which reached record levels by the end of fiscal year 2022. As our customers digest this inventory buildup, we are rightsizing capacity levels with this lull in demand. In light of this inventory digestion, we expect revenue to be lower than we previously anticipated. In order to provide more visibility into this dynamic, starting this quarter, we will break out revenue contributions from our Large Regional Service Provider customers, such as Lumen, Frontier, and Windstream. Historical financials for the new market segmentation can be found in the Appendix on slide 22. I want to stress that we have not lost any customers in this segment, and we believe we will continue to take share in this segment when growth returns. We remain confident that long - term demand for high - speed broadband remains strong and that we are well - positioned to benefit from the significant rural broadband build that is still in front of us. While we are rightsizing capacity levels to meet current demand, we are maintaining the infrastructure and processes for long - term growth and continue to design products to address our customers’ biggest pain points and reduce the amount of skilled labor required to install. As many of you are aware, our primary end market is Community Broadband, which is predominantly comprised of Tier 2 and Tier 3 incumbent local exchange carriers as well as a number of municipalities, utilities, co - ops, and wireless carriers. While there are pockets of excess inventory within this market segment, we believe it has less exposure to these headwinds. I now want to highlight how Clearfield is preparing to take share once we get through this period of inventory digestion. 4
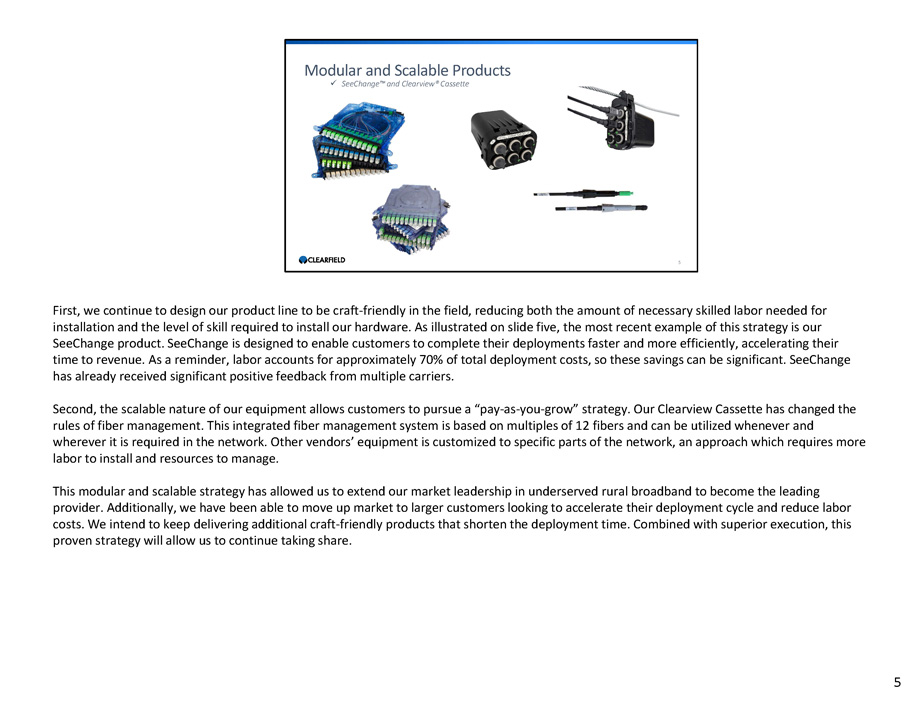
Modular and Scalable Products x SeeChange Ρ and Clearview® Cassette 5 First, we continue to design our product line to be craft - friendly in the field, reducing both the amount of necessary skilled labor needed for installation and the level of skill required to install our hardware. As illustrated on slide five, the most recent example of this strategy is our SeeChange product. SeeChange is designed to enable customers to complete their deployments faster and more efficiently, accelerating their time to revenue. As a reminder, labor accounts for approximately 70% of total deployment costs, so these savings can be significant. SeeChange has already received significant positive feedback from multiple carriers. Second, the scalable nature of our equipment allows customers to pursue a “pay - as - you - grow” strategy. Our Clearview Cassette has changed the rules of fiber management. This integrated fiber management system is based on multiples of 12 fibers and can be utilized whenever and wherever it is required in the network. Other vendors’ equipment is customized to specific parts of the network, an approach which requires more labor to install and resources to manage. This modular and scalable strategy has allowed us to extend our market leadership in underserved rural broadband to become the leading provider. Additionally, we have been able to move up market to larger customers looking to accelerate their deployment cycle and reduce labor costs. We intend to keep delivering additional craft - friendly products that shorten the deployment time. Combined with superior execution, this proven strategy will allow us to continue taking share. 5

Providing Optimized Price Performance and Deep Technical Expertise Why We Win x Singularly Focused on Serving the Fiber Market x Attractive Total Cost of Ownership through Reduced Installation Cost and Maintenance Time x Our Testing Shows FastPass TM Approach Cuts Install Time Required for Homes Passed by 50% x Ease, Speed, and Cost of Deployment x Delivery of a Comprehensive Solution x Commitment to Quality and Customers x Acquisition of Nestor Cables Highlights Investment to Integrate and Optimize Solutions and Mitigate Supply Chain Risk 6 6 Please turn to slide 6 . To further enhance our positioning, we have worked to improve our product delivery lead times . During the pandemic, lead times reached a height of 20 weeks due to supply constraints . Lead times are now in the range of six to eight weeks and we are targeting long - term lead times of four to six weeks across all product lines with the exception of active cabinets, which still face supply constraints . This work to improve our lead times comes as our customer ordering cycles return to pre - COVID patterns but at post - COVID volumes . For some additional insights on what we are seeing in the market and the significant long - term opportunity, I would like to welcome our Chief Marketing Officer, Kevin Morgan, to the call . Kevin .

Fiber Deployment shift is occurring in 2023 Source: RVA, February 2023 Millions 7 FTTH Homes Marketed U.S. Cumulative 70 60 50 40 30 20 10 0 FY19 FY20 FY21 FY22 FY23 * FY24 * FY25 * FY26 * Tel - ILEC Tier 1 Other Service Providers * Projected Thank you, Cheri. It’s great to be joining all of you this afternoon. The latest market research forecast from RVA, a leading market research authority in the field of fiber optic telecommunications market research, reflects the industry commitment to fiber expansion. As you can see from the chart, the Tier 1 Independent Local Exchange Carriers, or ILECs, led the initial buildout phase of the Fiber to the Home market during the first 20 years of deployment. However, in 2023 a shift is occurring in the market. According to the data, the other service providers in the market collectively will surpass the cumulative Fiber to the Homes marketed total of the Tier 1 ILECs. Other Service Providers include the Community Broadband and MSO customer segments. The appetite for high - speed broadband communications has never been greater and shows no sign of letting up. This continues to drive fiber deployments deeper into every corner of society and across all market segments. As Cheri mentioned, we believe our work to maintain our world - class lead times and further progress our LEAP strategic plan enhances our position for the long - term demand environment. In 2022 Fiber Provider Survey, published in December, the Fiber Broadband Association estimated a 10 - year annual average run rate of 11.3 million fiber deployments. In 2022 alone, fiber providers passed 7.9 million additional homes, representing a new record for annual deployment. This momentum gives us a powerful foundation for 2023 and the years ahead. We’re positioned within an investment cycle that has yet to reach its peak. We continue to view the gradual disbursement of ARPA and RDOF funds — and the upcoming distribution of BEAD funding – as meaningful, but gradual, industry tailwinds that further expand our market opportunity. Turning back to Clearfield’s fiscal second quarter performance, I’d now like to pass the call over to our CFO, Dan Herzog, who will walk us through our financial results for the fiscal second quarter of 2023. 7
8 Financial Performance Thank you, Kevin, and good afternoon, everyone. Please turn to slide 9 to look at our fiscal second quarter 2023 results in more detail… 8
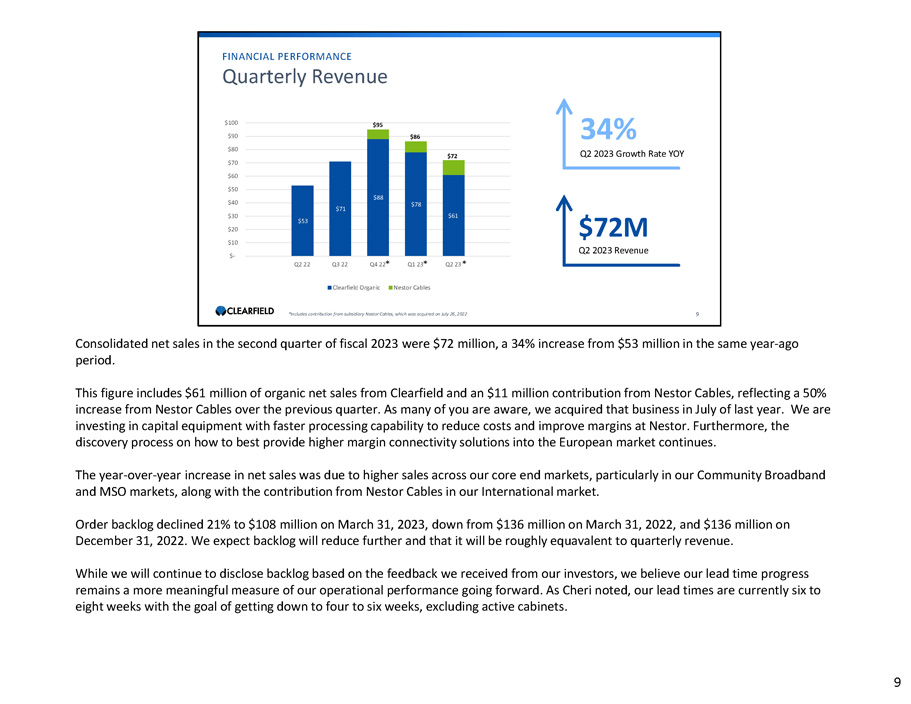
$53 $71 $88 $78 $61 $20 $10 $ - $30 $40 $70 $60 $50 $80 $90 $100 FINANCIAL PERFORMANCE Quarterly Revenue 34% Q2 2023 Growth Rate YOY $72M Q2 2023 Revenue 9 $95 $86 $72 Q2 22 Q3 22 Q4 22 * Q1 23 * Q2 23 * Clearfield Organic Nestor Cables *Includes contribution from subsidiary Nestor Cables, which was acquired on July 26, 2022 Consolidated net sales in the second quarter of fiscal 2023 were $72 million, a 34% increase from $53 million in the same year - ago period. This figure includes $61 million of organic net sales from Clearfield and an $11 million contribution from Nestor Cables, reflecting a 50% increase from Nestor Cables over the previous quarter. As many of you are aware, we acquired that business in July of last year. We are investing in capital equipment with faster processing capability to reduce costs and improve margins at Nestor. Furthermore, the discovery process on how to best provide higher margin connectivity solutions into the European market continues. The year - over - year increase in net sales was due to higher sales across our core end markets, particularly in our Community Broadband and MSO markets, along with the contribution from Nestor Cables in our International market. Order backlog declined 21% to $108 million on March 31, 2023, down from $136 million on March 31, 2022, and $136 million on December 31, 2022. We expect backlog will reduce further and that it will be roughly equavalent to quarterly revenue. While we will continue to disclose backlog based on the feedback we received from our investors, we believe our lead time progress remains a more meaningful measure of our operational performance going forward. As Cheri noted, our lead times are currently six to eight weeks with the goal of getting down to four to six weeks, excluding active cabinets. 9
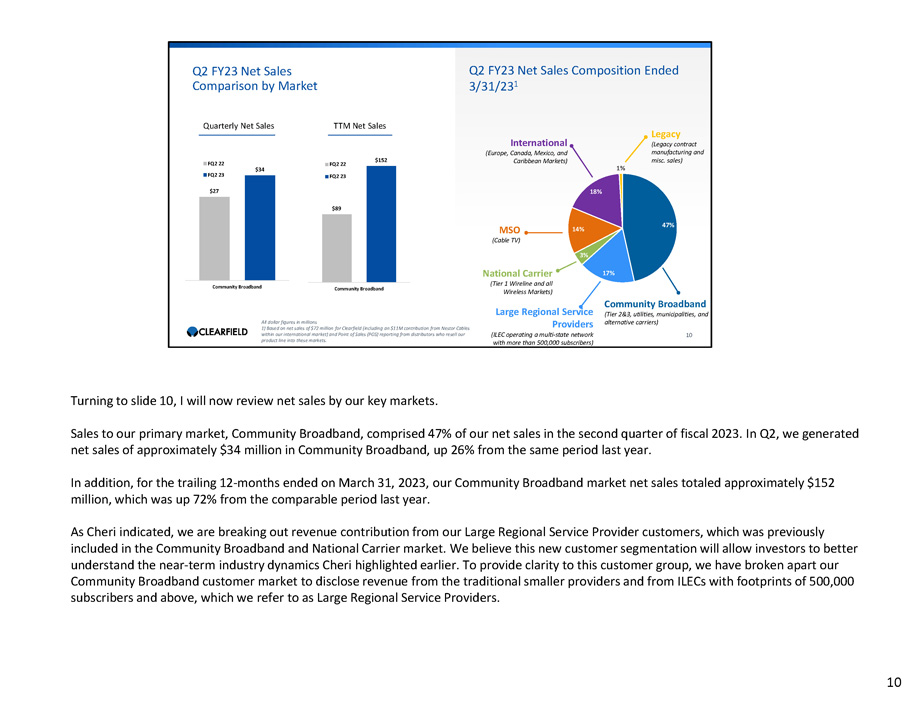
Q2 FY23 Net Sales Comparison by Market All dollar figures in millions 1) Based on net sales of $72 million for Clearfield (including an $11M contribution from Nestor Cables within our international market) and Point of Sales (POS) reporting from distributors who resell our product line into these markets. Q2 FY23 Net Sales Composition Ended 3/31/23 1 Legacy (Legacy contract manufacturing and misc. sales) 47% 17% 3% 14% 18% 1% $89 $152 Community Broadband FQ2 22 FQ2 23 Quarterly Net Sales TTM Net Sales Community Broadband (Tier 2&3, utilities, municipalities, and alternative carriers) MSO (Cable TV) International (Europe, Canada, Mexico, and Caribbean Markets) 10 $27 $34 Community Broadband FQ2 22 FQ2 23 National Carrier (Tier 1 Wireline and all Wireless Markets) Large Regional Service Providers (ILEC operating a multi - state network with more than 500,000 subscribers) Turning to slide 10, I will now review net sales by our key markets. Sales to our primary market, Community Broadband, comprised 47% of our net sales in the second quarter of fiscal 2023. In Q2, we generated net sales of approximately $34 million in Community Broadband, up 26% from the same period last year. In addition, for the trailing 12 - months ended on March 31, 2023, our Community Broadband market net sales totaled approximately $152 million, which was up 72% from the comparable period last year. As Cheri indicated, we are breaking out revenue contribution from our Large Regional Service Provider customers, which was previously included in the Community Broadband and National Carrier market. We believe this new customer segmentation will allow investors to better understand the near - term industry dynamics Cheri highlighted earlier. To provide clarity to this customer group, we have broken apart our Community Broadband customer market to disclose revenue from the traditional smaller providers and from ILECs with footprints of 500,000 subscribers and above, which we refer to as Large Regional Service Providers. 10
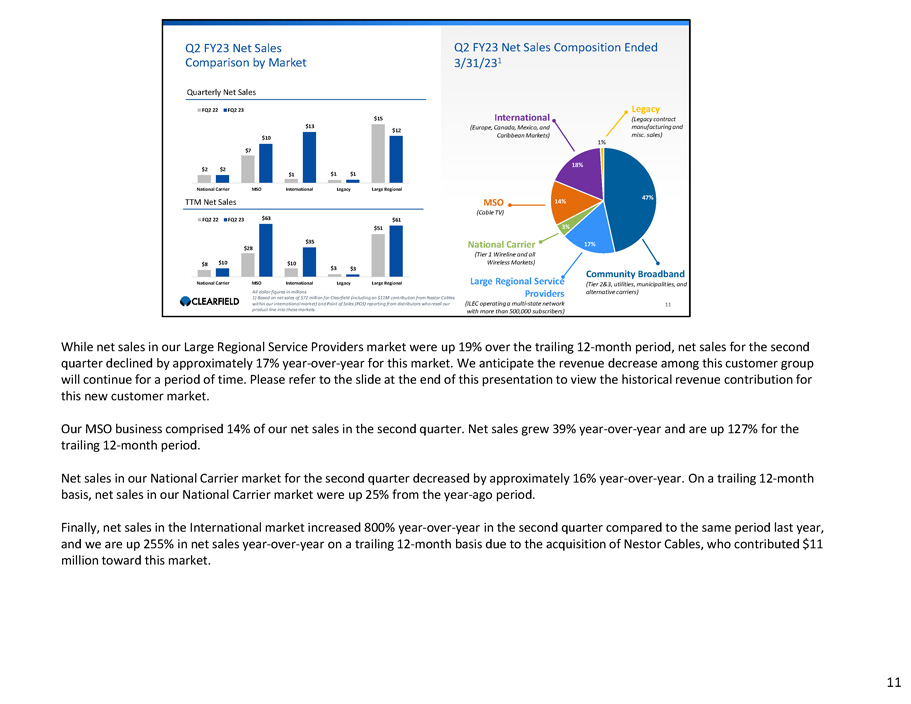
$8 $28 $10 $51 $10 $63 $35 $3 $3 $61 National Carrier FQ2 22 FQ2 23 $7 $1 $15 $2 $2 $10 $13 $1 $1 $12 National Carrier MSO International Legacy Large Regional Q2 FY23 Net Sales Comparison by Market Quarterly Net Sales FQ2 22 FQ2 23 TTM Net Sales MSO International Legacy Large Regional All dollar figures in millions 1) Based on net sales of $72 million for Clearfield (including an $11M contribution from Nestor Cables within our international market) and Point of Sales (POS) reporting from distributors who resell our product line into these markets. Q2 FY23 Net Sales Composition Ended 3/31/23 1 Legacy (Legacy contract manufacturing and misc. sales) 47% 17% 3% 14% 18% 1% MSO (Cable TV) International (Europe, Canada, Mexico, and Caribbean Markets) Community Broadband (Tier 2&3, utilities, municipalities, and alternative carriers) 11 National Carrier (Tier 1 Wireline and all Wireless Markets) Large Regional Service Providers (ILEC operating a multi - state network with more than 500,000 subscribers) While net sales in our Large Regional Service Providers market were up 19 % over the trailing 12 - month period, net sales for the second quarter declined by approximately 17 % year - over - year for this market . We anticipate the revenue decrease among this customer group will continue for a period of time . Please refer to the slide at the end of this presentation to view the historical revenue contribution for this new customer market . Our MSO business comprised 14% of our net sales in the second quarter. Net sales grew 39% year - over - year and are up 127% for the trailing 12 - month period. Net sales in our National Carrier market for the second quarter decreased by approximately 16% year - over - year. On a trailing 12 - month basis, net sales in our National Carrier market were up 25% from the year - ago period. Finally, net sales in the International market increased 800 % year - over - year in the second quarter compared to the same period last year, and we are up 255 % in net sales year - over - year on a trailing 12 - month basis due to the acquisition of Nestor Cables, who contributed $ 11 million toward this market . 11
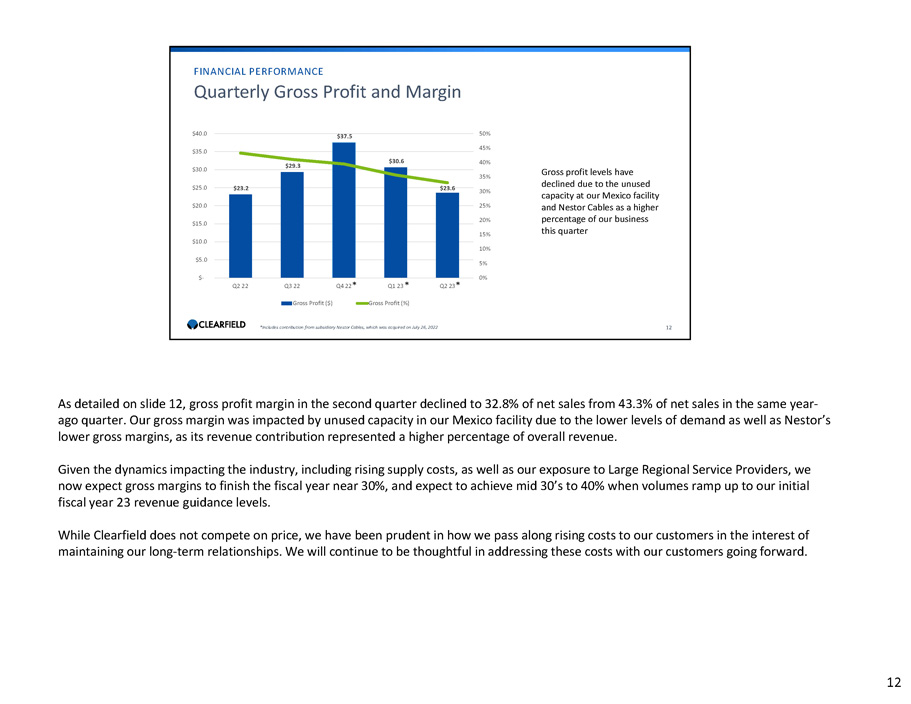
Quarterly Gross Profit and Margin $29.3 $37.5 $30.6 $23.6 0% 5% 10% 30% 35% 40% 45% 50% $ - $5.0 $10.0 $15.0 20% 15% $20.0 25% $25.0 $23.2 $30.0 $35.0 $40.0 FINANCIAL PERFORMANCE 12 Gross profit levels have declined due to the unused capacity at our Mexico facility and Nestor Cables as a higher percentage of our business this quarter *Includes contribution from subsidiary Nestor Cables, which was acquired on July 26, 2022 Q2 22 Q3 22 Q4 22 * Q1 23 * Q2 23 * Gross Profit ($) Gross Profit (%) As detailed on slide 12, gross profit margin in the second quarter declined to 32.8% of net sales from 43.3% of net sales in the same year - ago quarter. Our gross margin was impacted by unused capacity in our Mexico facility due to the lower levels of demand as well as Nestor’s lower gross margins, as its revenue contribution represented a higher percentage of overall revenue. Given the dynamics impacting the industry, including rising supply costs, as well as our exposure to Large Regional Service Providers, we now expect gross margins to finish the fiscal year near 30 % , and expect to achieve mid 30 ’s to 40 % when volumes ramp up to our initial fiscal year 23 revenue guidance levels . While Clearfield does not compete on price, we have been prudent in how we pass along rising costs to our customers in the interest of maintaining our long - term relationships . We will continue to be thoughtful in addressing these costs with our customers going forward . 12
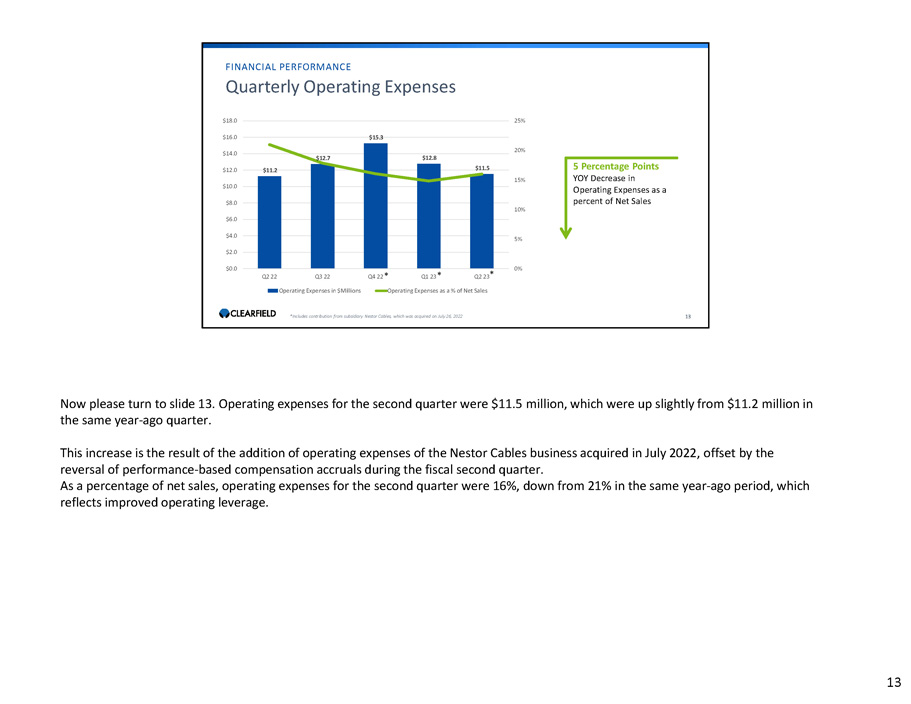
$11.2 $12.7 $12.8 $11.5 0% 5% 10% 15% 20% $2.0 $0.0 $6.0 $4.0 $10.0 $8.0 $12.0 $14.0 $18.0 25% $16.0 $15.3 FINANCIAL PERFORMANCE 5 Percentage Points YOY Decrease in Operating Expenses as a percent of Net Sales 13 Quarterly Operating Expenses Q2 22 Q3 22 Q4 22 * Q1 23 * Q2 23 * Operating Expenses in $Millions Operating Expenses as a % of Net Sales *Includes contribution from subsidiary Nestor Cables, which was acquired on July 26, 2022 Now please turn to slide 13. Operating expenses for the second quarter were $11.5 million, which were up slightly from $11.2 million in the same year - ago quarter. This increase is the result of the addition of operating expenses of the Nestor Cables business acquired in July 2022, offset by the reversal of performance - based compensation accruals during the fiscal second quarter. As a percentage of net sales, operating expenses for the second quarter were 16%, down from 21% in the same year - ago period, which reflects improved operating leverage. 13
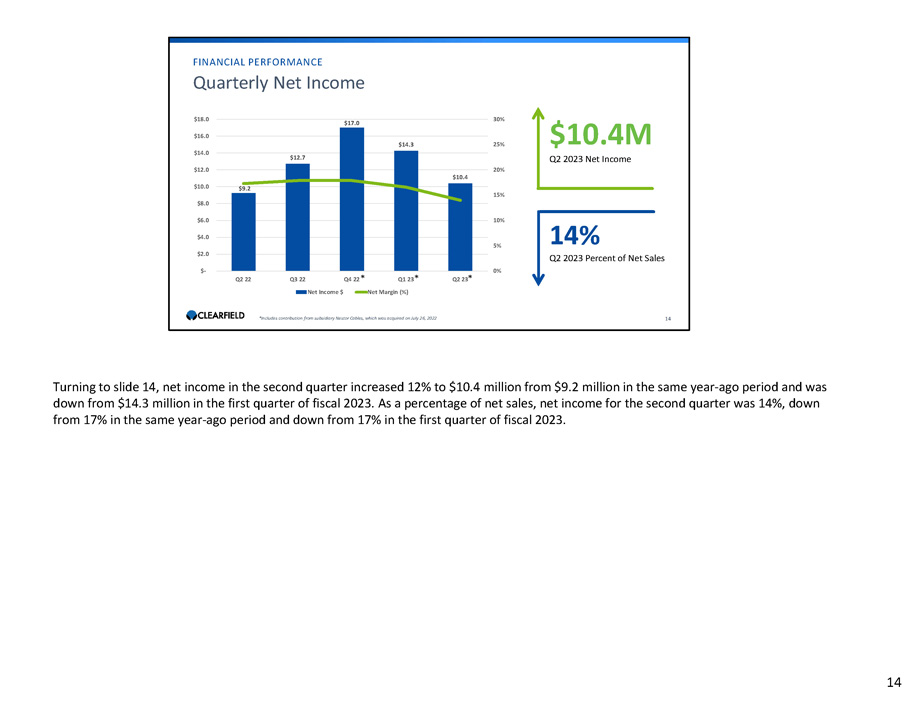
$9.2 $12.7 $17.0 $14.3 5% 10% 15% 25% 30% $2.0 $4.0 $8.0 $6.0 $10.0 $12.0 20% $10.4 $14.0 $16.0 $18.0 Net Income $ Q1 23 * Q2 23 * Net Margin (%) $ - 0% Q2 22 Q3 22 Q4 22 * $10.4M Q2 2023 Net Income 14% Q2 2023 Percent of Net Sales 14 FINANCIAL PERFORMANCE Quarterly Net Income *Includes contribution from subsidiary Nestor Cables, which was acquired on July 26, 2022 Turning to slide 14, net income in the second quarter increased 12% to $10.4 million from $9.2 million in the same year - ago period and was down from $14.3 million in the first quarter of fiscal 2023. As a percentage of net sales, net income for the second quarter was 14%, down from 17% in the same year - ago period and down from 17% in the first quarter of fiscal 2023. 14
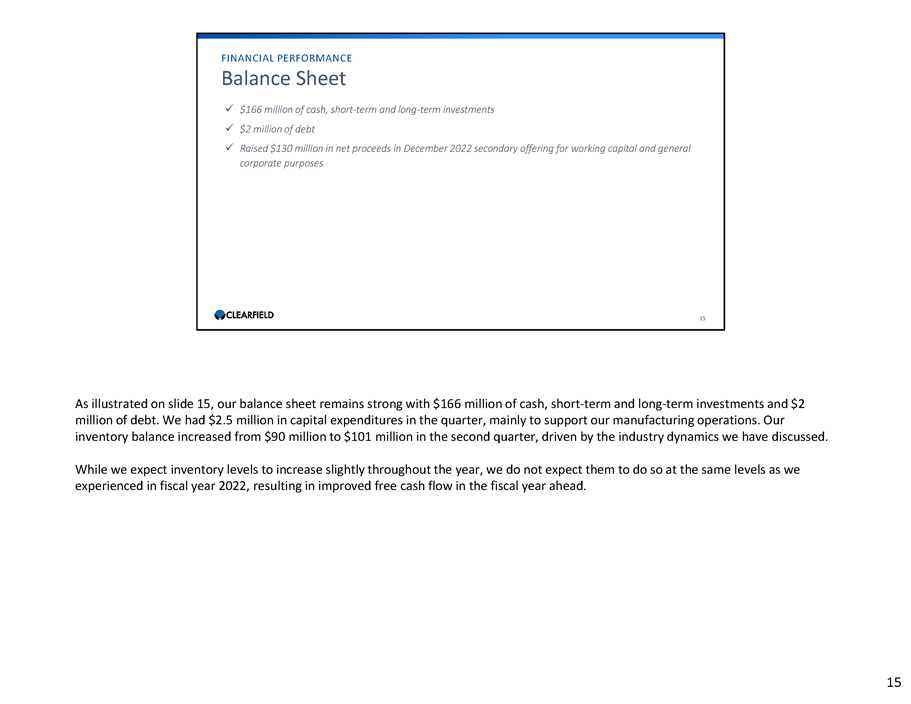
FINANCIAL PERFORMANCE Balance Sheet x $166 million of cash, short - term and long - term investments x $2 million of debt x Raised $130 million in net proceeds in December 2022 secondary offering for working capital and general corporate purposes 15 15 As illustrated on slide 15, our balance sheet remains strong with $166 million of cash, short - term and long - term investments and $2 million of debt. We had $2.5 million in capital expenditures in the quarter, mainly to support our manufacturing operations. Our inventory balance increased from $90 million to $101 million in the second quarter, driven by the industry dynamics we have discussed. While we expect inventory levels to increase slightly throughout the year, we do not expect them to do so at the same levels as we experienced in fiscal year 2022, resulting in improved free cash flow in the fiscal year ahead.
16 Business Update & Outlook As Cheri noted, we now expect revenue for the full year to be in the range of $260 to $275 million. Additionally, we now expect net income per diluted share to be in the range of $1.80 to $2.10 per share. With the capital raise we undertook last year, we plan to continue investing in our infrastructure and other necessary strategic areas. Additionally, our strong balance sheet ensures that we are well - positioned to effectively compete for larger customer opportunities and the ability to pursue strategic opportunities to enhance our product portfolio. That concludes my prepared remarks for our second quarter of fiscal 2023. We appreciate the support of our investors as we continue to work to drive shareholder value. I will now turn the call back over to Cheri. 16
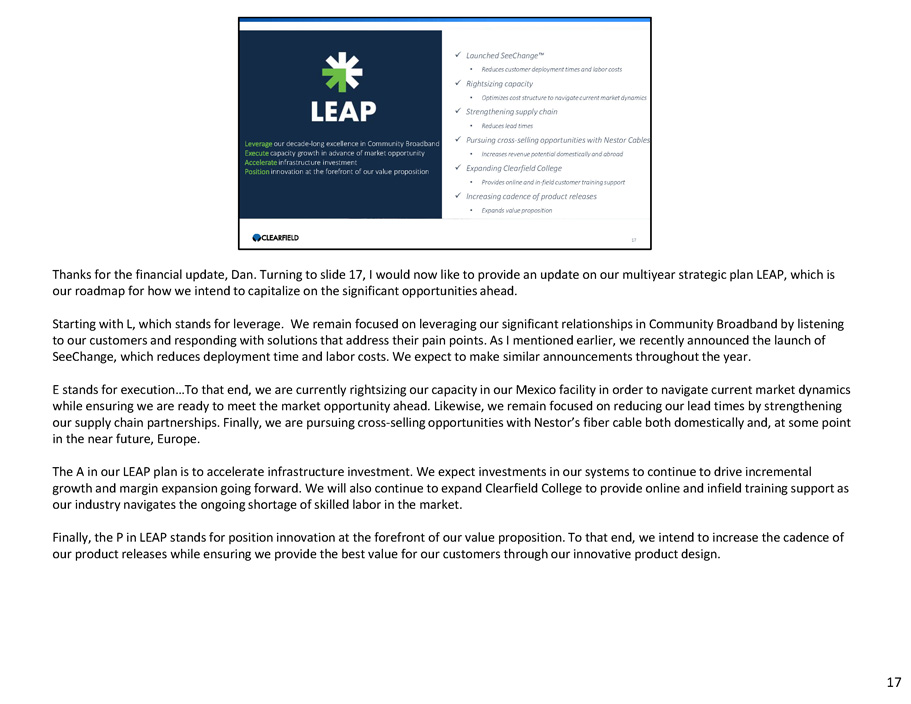
x Launched SeeChange Ρ • Reduces customer deployment times and labor costs x Rightsizing capacity • Optimizes cost structure to navigate current market dynamics x Strengthening supply chain • Reduces lead times x Pursuing cross - selling opportunities with Nestor Cables • Increases revenue potential domestically and abroad x Expanding Clearfield College • Provides online and in - field customer training support x Increasing cadence of product releases • Expands value proposition Leverage our decade - long excellence in Community Broadband Execute capacity growth in advance of market opportunity Accelerate infrastructure investment Position innovation at the forefront of our value proposition 17 17 Thanks for the financial update, Dan. Turning to slide 17, I would now like to provide an update on our multiyear strategic plan LEAP, which is our roadmap for how we intend to capitalize on the significant opportunities ahead. Starting with L, which stands for leverage. We remain focused on leveraging our significant relationships in Community Broadband by listening to our customers and responding with solutions that address their pain points. As I mentioned earlier, we recently announced the launch of SeeChange, which reduces deployment time and labor costs. We expect to make similar announcements throughout the year. E stands for execution…To that end, we are currently rightsizing our capacity in our Mexico facility in order to navigate current market dynamics while ensuring we are ready to meet the market opportunity ahead. Likewise, we remain focused on reducing our lead times by strengthening our supply chain partnerships. Finally, we are pursuing cross - selling opportunities with Nestor’s fiber cable both domestically and, at some point in the near future, Europe. The A in our LEAP plan is to accelerate infrastructure investment. We expect investments in our systems to continue to drive incremental growth and margin expansion going forward. We will also continue to expand Clearfield College to provide online and infield training support as our industry navigates the ongoing shortage of skilled labor in the market. Finally, the P in LEAP stands for position innovation at the forefront of our value proposition. To that end, we intend to increase the cadence of our product releases while ensuring we provide the best value for our customers through our innovative product design.
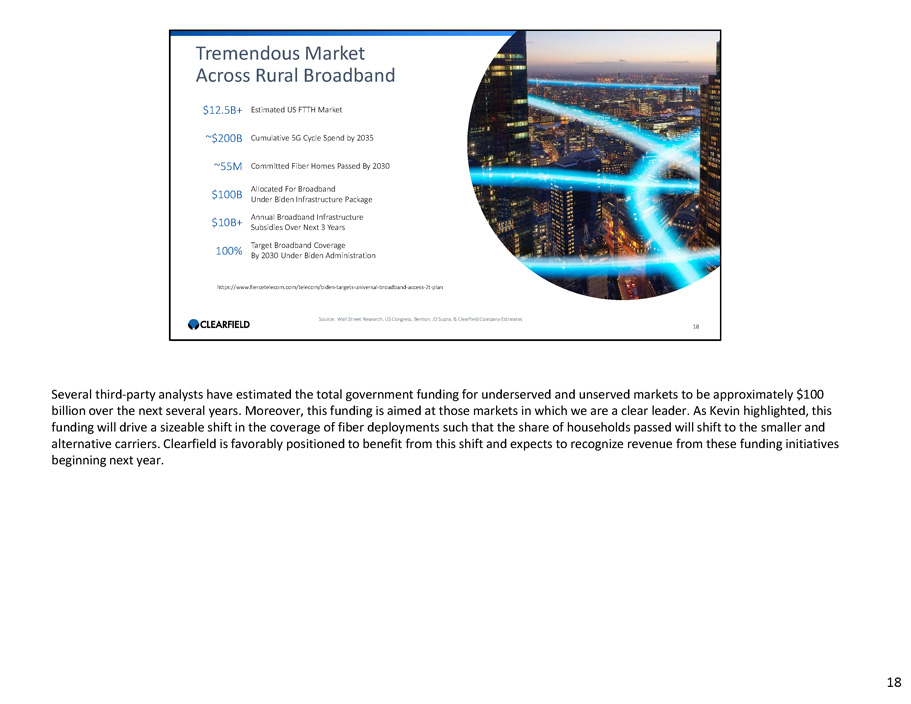
$12.5B+ Estimated US FTTH Market ~$200B Cumulative 5G Cycle Spend by 2035 ~55M Committed Fiber Homes Passed By 2030 Allocated For Broadband Under Biden Infrastructure Package $100B Annual Broadband Infrastructure Subsidies Over Next 3 Years $10B+ Target Broadband Coverage By 2030 Under Biden Administration 100% Tremendous Market Across Rural Broadband Source: Wall Street Research, US Congress, Benton, JD Supra, & Clearfield Company Estimates 18 https:// www.fiercetelecom.com/telecom/biden - targets - universal - broadband - access - 2t - plan Several third - party analysts have estimated the total government funding for underserved and unserved markets to be approximately $100 billion over the next several years. Moreover, this funding is aimed at those markets in which we are a clear leader. As Kevin highlighted, this funding will drive a sizeable shift in the coverage of fiber deployments such that the share of households passed will shift to the smaller and alternative carriers. Clearfield is favorably positioned to benefit from this shift and expects to recognize revenue from these funding initiatives beginning next year. 18
Long - term Catalysts x Government Funding for unserved and underserved communities x European Expansion x 5G: Wireless and Wireline Integration x Cloud, Edge and IoT Architecture 19 In addition to the significant demand generated by the government funding outlays, we are preparing for several large opportunities over the coming years, including expansion into Europe, for which Nestor Cables provides a strong base, the integration of wireline and wireless architectures as 5G ramps up, and the evolution of the fiber network to the edge to manage low latency, data intensive applications. 19
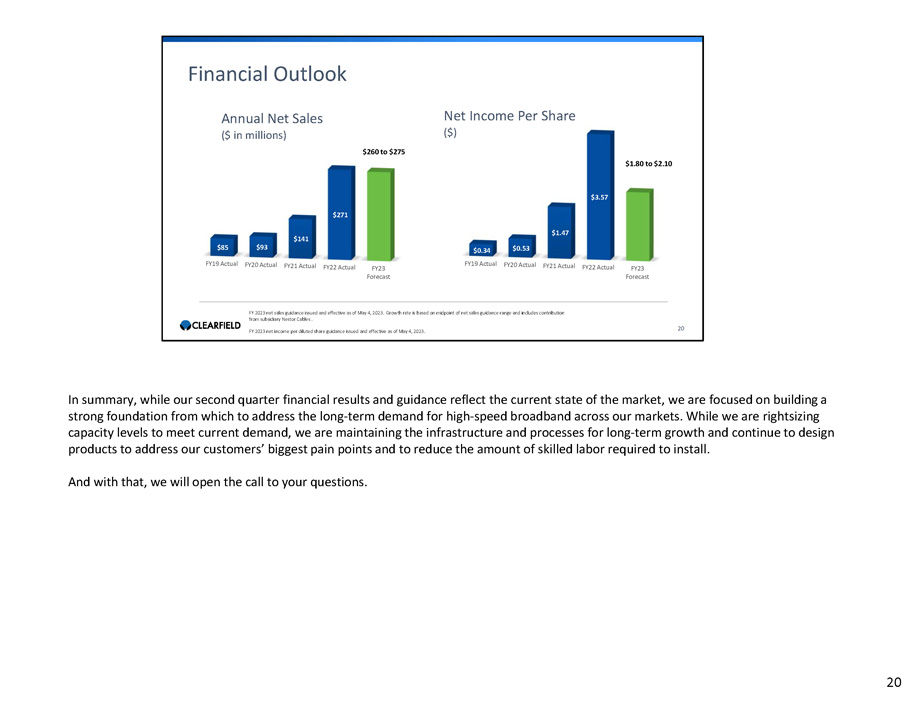
FY19 Actual FY20 Actual FY21 Actual FY22 Actual FY23 Forecast $85 $93 $141 $271 $260 to $275 FY 2023 net sales guidance issued and effective as of May 4, 2023. Growth rate is based on midpoint of net sales guidance range and includes contribution from subsidiary Nestor Cables . FY 2023 net income per diluted share guidance issued and effective as of May 4, 2023. Annual Net Sales ($ in millions) 20 Financial Outlook FY19 Actual FY20 Actual FY21 Actual FY22 Actual FY23 Forecast $0.34 $0.53 $1.47 $3.57 $1.80 to $2.10 Net Income Per Share ($) In summary, while our second quarter financial results and guidance reflect the current state of the market, we are focused on building a strong foundation from which to address the long - term demand for high - speed broadband across our markets. While we are rightsizing capacity levels to meet current demand, we are maintaining the infrastructure and processes for long - term growth and continue to design products to address our customers’ biggest pain points and to reduce the amount of skilled labor required to install. And with that, we will open the call to your questions. 20
Cheri Beranek PRESIDENT & CEO Dan Herzog CHIEF FINANCIAL OFFICER Q&A 21 Kevin Morgan CHIEF MARKETING OFFICER Thank you. We will now begin the question - and - answer session. Our first question comes from Ryan Koontz with Needham. Please go ahead. Ryan Koontz Needham & Company, LLC Hi, thanks for the question and thanks for the added metrics on the regionals, clearly an area of concern here. I wonder if you can kind of walk through, I mean, we've seen the regionals, a lot of them downsize their plans and revised CapEx lower this year, that's obviously a contributor and kind of doubling the problem of over buying last year. What if you could reflect on that, and maybe some of the other segments, specifically Community Broadband, and how you think about that market evolving over the next couple of quarters? Where I don't think we were aware of such an inventory issue, but is labor, or labor cost as big of an issue in the Community Broadband side as well as the regionals? Thanks. Cheri Beranek President and CEO Thanks, Ryan. Yeah, it's, as you've noted, this is very much an industry issue as it relates to the Regional Service Providers in that the economic and world macroeconomic issues across the world and inflation and the like are causing some other Regional Service Providers to readdress their CapEx as they've announced over the course of really the last month. And as you stated, that seemed with the fact that they did place a significant just in case inventory position last year that I think they even came to better understand as we came into the beginning of the build season, because we started our conversations with them in February and March and April, there was definitely a different tune to what they were doing. Long - term absolute commitment to broadband, and as many others in the industry have talked about, today and over the last week, we see a strong return to broadband deployment in the latter half of the year. It's just unfortunate for Clearfield that our latter half of the year is not that far away, since our year - end happens in September. 21
Cheri Beranek PRESIDENT & CEO Q&A 22 Dan Herzog Kevin Morgan CHIEF FINANCIAL OFFICER CHIEF MARKETING OFFICER Cheri Beranek President and CEO The EMEA with Community Broadband and comparison to the Regional Service Providers, is a little less inventory intense. There's some pockets out there, but mostly what we see there is a world in which there are so many more Community Broadband providers at a smaller scale, that there's just a number of them that are starting to ramp up that are starting their deployments. And our ability to have such a broad range of customers really shows the strength of our business in Community Broadband. I think in all of the areas, you're seeing issues associated with labor, we've been told that's getting better, but incrementally, not overnight. And the other thing that is emerging, less so in Community Broadband, but absolutely within the Regional Providers is challenges associated with permitting. And permitting is related not only to them being a single provider, but I'm hearing stories of multiple providers going into a market. And as a result, the cities and communities who are providing permits are just overrun with trying to be able to respond effectively. So I think there's a changing world a changing dynamic that's kind of going to have to work itself through. But we're excited and remain excited about our ability to execute within; it is just unfortunately, very bumpy. Ryan Koontz Needham & Company, LLC Understood, just a quick follow if I could around the ARPA contribution. Are you still seeing momentum there? Is there also a similar pause going on in the area, that these ARPA words that seem to be a nice steady stream of awards over the last few months? Cheri Beranek President and CEO Right, we're seeing that for the summer, that we will see this kind of revenues associated with that in Community Broadband, smaller providers, they're not going to be passing 10,000 homes this year. But those awards are going to communities that are passing 3,000 homes here 2,000 homes there. But they all add up and we're excited that we're working directly with some of those accounts and very much through distribution as well. Ryan Koontz Needham & Company, LLC Got it. Alright, I'll pass on to the queue. Thank you. 22
Cheri Beranek PRESIDENT & CEO Dan Herzog CHIEF FINANCIAL OFFICER Q&A 23 Kevin Morgan CHIEF MARKETING OFFICER Operator Our next question comes from Jaeson Schmidt with Lake Street please go ahead. Max Michaelis Lake Street Capital Markets,LLC Hey guys, this is Max on for Jaeson. Just in terms of the guide. I want to get your cadence for the next couple of quarters. In other words, should investors see a drop in revenue? Cheri Beranek President and CEO We anticipate the next couple of quarters will be pretty consistent with each other . So it'll drop from current conditions, for third quarter and then third and fourth quarter we think will be pretty consistent with each other . At this point the build season, the higher build season, and so as a result we tend to see some nice momentum already, which we haven't unfortunately picked up in March and April . We're looking for that in May and June and because of the lead times now shrinking drastically . That should work out just fine . Hope that answers your question . Max Michaelis Lake Street Capital Markets,LLC No, it does. Thank you. And then I just want to clear something up. So you've mentioned that GM, you expect gross margin, you expect to be 30%? Is that for the next two quarters? Or do you expect the entire fiscal year '23 gross margin to end up at 30%? Cheri Beranek President and CEO Yeah, no, that's cumulative. So obviously, third and fourth quarter will be less than that. Max Michaelis Lake Street Capital Markets,LLC Okay, thank you. That's it for me, guys. 23
Cheri Beranek PRESIDENT & CEO Dan Herzog CHIEF FINANCIAL OFFICER Q&A 24 Kevin Morgan CHIEF MARKETING OFFICER Operator Our next question comes from Tim Savageaux with Northland Capital Markets. Please go ahead. Tim Savageaux Northland Capital Markets Hi, good afternoon. A couple of questions. As you look at your kind of reclass, you're going to assume you took Lumen out of National Carrier and insert it to Regional. But now if we look at that particular segment of revenue, I mean, should we consider that effectively going to de minimis levels, immaterial levels, the next couple of quarters as a primary driver of the revenue decline? Cheri Beranek President and CEO Yeah, third and fourth quarter, it'll be it will be very small. And it's not just it's some situations about inventory push outs and then it's the order push outs, but then also our anticipation when we put together the initial guide for follow on orders that have not yet materialized. Now, with that said, looking forward, that's a very strong market opportunity for us. And our products are as well respected in that market as they are in Community Broadband. And none of those carriers represented more than 10% of our business in a single quarter. But, when they are high single digits, and there's multiple ones of them who have had some similar inventory carrying positions as well as some project deadlines associated with CapEx that gets pushed out, it starts to take a significant toll. Tim Savageaux Northland Capital Markets Okay, well, I guess maybe the reason I asked is that while community broadband, thinking that you obviously had a big second half of last year, the fiscal year. But the impact on the smaller carriers seems much less significant kind of maybe down slightly from current levels. Am I reading that the right way? And I know, you saw a big drop. Let's just hit that one. And we'll go to the next. 24
Cheri Beranek PRESIDENT & CEO Dan Herzog CHIEF FINANCIAL OFFICER Q&A 25 Kevin Morgan CHIEF MARKETING OFFICER Cheri Beranek President and CEO I mean if we look at the course of Community Broadband as an aggregate, and in second quarter in comparison to the last 12 months. So second quarter is up high 20% in comparison to the 70% some it was up over the course of the last year. So that really represents there are some inventory positions within Community Broadband as well, some pockets and some of the larger Community Broadband carriers. But what's different there is as we look to third quarter is there will be new Community Broadband providers we are working with that will come online. The question really will be how fast they will come online for their permitting and their different issues. Long term, I think we see the balance kind of returning to where we're at today, but there's going to be some downturn over the course of the next two quarters, as you highlighted, it's going to be predominantly because of the large providers who are using the inventory positions they have to deploy for this summer. Tim Savageaux Northland Capital Markets Okay, got it. And then maybe just kind of a similar question on the cable side. You obviously saw a pretty significant drop off there in the second quarter. But looking forward, you did reference, I guess I don't know, to the extent to which your commentary on cable was about the quarter or forward looking and whether you expect further significant declines from that segment to the balance of the year. 25
Cheri Beranek PRESIDENT & CEO Dan Herzog CHIEF FINANCIAL OFFICER Q&A 26 Kevin Morgan CHIEF MARKETING OFFICER Cheri Beranek President and CEO Yeah, we did mention that it was going to be among the clients were within Regional Service Providers as well as to the more limited basis within the MSOs. So I really don't see that much difference between the segments about the differences in regard to rate. What's different is the single one carrier can represent multiple millions of the forecast in MSOs and in Regional Service Provider, rather than Community Broadband, a much smaller number. So then again, the intent within cable TV, I don't see it as being any different. They're very bullish on being able to protect their strong base of ownership in the residential broadband market. But as some of the CapEx spend among the telcos decreases, the threat that they have been experiencing also declines. And so what I see across the industry is, whereas last year, it was a foot race, for being able to get a land grab, whoever was passing that home first, was going to get that business. And what we see this year is really changing that position from being a land grab to today being more about success - based deployment, and really concentrating on connecting the homes that they've passed already, in addition to additional homes moving forward. So they've got to change, their ROI models have to change, their cost to pass a home was under estimated labor costs are much more than what many of these accounts thought they were going to be. And that said the interest rates now for this year are totally different position than whether business plans were based on. And so it's really pushed out, the opportunity, rather than for it to be just immediate. I mean, if we look at the Fiber - to - the - Home Council’s numbers, they said we hit a record of 7 . 9 million homes last year, which is fantastic . But they also said that over the next 10 years, the average was going to be over 11 . I mean, it's all just pushed out moving forward, rather than for it to be in a shorter period of time . 26
Cheri Beranek PRESIDENT & CEO Dan Herzog CHIEF FINANCIAL OFFICER Q&A 27 Kevin Morgan CHIEF MARKETING OFFICER Tim Savageaux Northland Capital Markets Okay, thanks very much. Last question from me. I mean, historically, kind of pre the big pandemic - driven surge, you had talked about kind of sustainable growth rates for Clearfield in kind of the double digit 10% to 15% range. As we kind of look forward realizing visibility is not great right now, care to frame growth expectations heading into '24 relative to those historic benchmarks? Cheri Beranek President and CEO While we're not giving '24 guidance, we firmly believe that Clearfield is in a position, as the shift moves from larger carriers to the smaller alternative carriers, that we can grow faster than market rates. And so that will be our goal, and our positioning by which to do that. Tim Savageaux Northland Capital Markets Thanks very much. 27
Cheri Beranek PRESIDENT & CEO Dan Herzog CHIEF FINANCIAL OFFICER Q&A 28 Kevin Morgan CHIEF MARKETING OFFICER Operator Our next question comes from Scott Searle with ROTH. Please go ahead. Scott Searle ROTH Capital Partners, LLC Hey, good afternoon. Thanks for taking my questions. Cheri maybe, just looking at the mix of business, across the different customers. Last year, was really a coverage year of building out the footprint, but you also get paid for the connection in the success - based CapEx. I'm wondering if you could give us an idea about what that mix of business looks across the broader base in general, where you're seeing the growth and how the gross margins compare, then a couple of follow ups. Cheri Beranek President and CEO Our gross margins for homes passed, as well as homes connected are actually quite similar. So that's doesn't change the gross profit outlook. We as a company have a much higher penetration in homes passed with our cabinet line than we do with the number of homes connected and that our share among homes connected is less than in our share of homes passed. One of our big initiatives this year is to establish ourselves and maybe to caveat in Community Broadband we have a much higher penetration of homes connected than we do in the Large Regional Service Providers. In the Regional Service Providers, we're very much about passing homes, and have not yet become a portfolio provider for the full range of our solutions. One of the reasons that we saw a need for even simpler products than we currently had. And so in addition to the terminals and drop cables that we had provided previously, this spring, we launched a product line called SeeChange. And SeeChange is an entirely pack and play, no splice, plug it in and move on solution. So not only it is easier to install, but it is easier to prepare. And so that is a patent protected new proprietary product to Clearfield, that's just been on the market now for about 60 days. And so it'll be as we look forward into '24 and beyond one of the tools by which that will have to increase that penetration rate into homes connected. 28
Cheri Beranek PRESIDENT & CEO Dan Herzog CHIEF FINANCIAL OFFICER Q&A 29 Kevin Morgan CHIEF MARKETING OFFICER Scott Searle ROTH Capital Partners, LLC Right, very helpful. And maybe to follow up. I know, we talked a lot about excess inventory and kind of hitting the pause button and a number of the different categories in terms of Regional Providers and MSOs. But do you have an idea of what the existing inventory levels look like, within those two groups? It seems like it's built into the expectations now have, it's going to persist into June and September timeframe. But it also seems like you're seeing some indication that maybe in December, there starts to be a pickup. So thoughts on inventory within those customers, and two quarters to kind of work through those inventory excess levels. Cheri Beranek President and CEO Yeah, so we do have visibility into some of the accounts directly into their own Excel charts and their own inventory levels. And we do it into the distributors, but not necessarily into every Community Broadband provider. We do talk with every -- with most Community Broadband customers, at least quarterly and all of the Regional Service Providers probably weekly, if not daily, depending upon who we're talking to. So we don't -- I can't give you an absolute that it's -- it's three months or six months in regard to the inventory position. Because I think part of it is whether or not these customers are going to actually execute to the plans that they implemented. Because last year bluntly they didn't execute to their original plan, which is why they have this excess inventory. So I think my best response to that is we're entirely bullish on the environment, we took a conservative approach to this guidance level, because of the uncertainty and the uncertainty toward their plan versus their execution and their demonstrated history. And we'll keep our investors as advised as we can. And it's why we broke out the additional market segments so that we can continue to be as transparent as possible. But I think one of the fabulous parts about Clearfield is we built this company, they make money from the beginning. And so for nine consecutive quarters, we increased the top - line growth as a company by 40%. While we were delivering high - teens in net income. There's an expense to that, or the return on that has been strongly for investors over the course of the last nine quarters. And now there's bluntly yes, we have a capacity in excess of what current demand is them, but we've executed strongly to demand when demand was there. And I think we know as an environment that the demand will return, our product lines have been well received. And now we have additional infrastructure by which to respond so we can grow to our original forecasted levels not this year, but certainly in the years to come. 29
Cheri Beranek PRESIDENT & CEO Dan Herzog CHIEF FINANCIAL OFFICER Q&A 30 Kevin Morgan CHIEF MARKETING OFFICER Scott Searle ROTH Capital Partners, LLC Great, very helpful. And lastly, if I could on the gross margin font. Certainly you're going through some absorption issues over the next couple of quarters, but you referenced rationalizing some of the Mexican capacity. What if you could talk about that? And then as well, inventory levels are elevated by design. But now as the world is started normalized from a supply chain perspective. How is that playing into the gross margin headwinds? Because you're not running the factories as hard as well the absorption issues exacerbating that and how quickly do they come back then as with the top - line starting to recover, at some point as we get into fiscal ‘24, thanks. 30

Cheri Beranek PRESIDENT & CEO Dan Herzog CHIEF FINANCIAL OFFICER Q&A 31 Kevin Morgan CHIEF MARKETING OFFICER Cheri Beranek President and CEO So you're right, we have capacity allocations that are being --- overhead allocations that have not been absorbed. We have, on some of the variable costs, we have reduced our costs by having fewer workers in some of our factories. And from an inventory standpoint, there is an increase associated with our inventory ---- some of it organic Clearfield, and also a significant increase at Nestor Cables. And we couldn't be more proud of Nestor Cables' increase over the first quarter of almost 50%. The demand opportunity in Europe is proving to be significant. And when we anticipate to see a strong Nestor Cables' contribution in third quarter. And that's the good part. The unfortunate part of that is they're at a lower gross profit percentage than organic Clearfield is so the mix between Clearfield and Nestor is going to bring that number down. Now, we are significantly investing in additional equipment and lines and capacity in Europe so that we can increase the gross profit of Nestor, and not necessarily on the cables to Clearfield connectivity levels, but as we introduce connectivity products into Europe, we'll see our global gross profit numbers going up. As we look into '24, it will be -- it's still we can't take the fixed costs out of our Mexican facilities and our Minneapolis facilities. But we're certainly managing the variable costs to the best levels that we can. And we anticipate we would be at a gross margin level, close to what we forecast of about 40% once we hit the revenue lines that we had in this year's guidance program. Scott Searle ROTH Capital Partners, LLC Thank you 31
Cheri Beranek PRESIDENT & CEO Dan Herzog CHIEF FINANCIAL OFFICER Q&A 32 Kevin Morgan CHIEF MARKETING OFFICER Operator Our next question comes from Greg Mesniaeff. Please go ahead. Greg Mesniaeff WestPark Capital Yes, thank you. When you look at the order intake softness across your various customer categories. I'm assuming that the vast majority of it relates to products designed for the residential broadband market and therefore the small to medium sized businesses, is that correct? Cheri Beranek President and CEO Our product line, the Clearview Cassette, can be used for residential as well as for business class deployment. It's one of the advantages of our architecture, so that you use all of the same products regardless of where it's being deployed. Greg Mesniaeff WestPark Capital Right, but you don't know -- you don't know whether the lower orders are related to softer residential demand on the part of your customers or business. That's not… Cheri Beranek President and CEO No, I couldn't tell you that. 32

Cheri Beranek PRESIDENT & CEO Dan Herzog CHIEF FINANCIAL OFFICER Q&A 33 Kevin Morgan CHIEF MARKETING OFFICER Greg Mesniaeff WestPark Capital Okay. And second part of the question is as you as your customer base, moves further upstream to the larger carriers, what kind of if any competitive landscape issues are you running into as far as competition? Cheri Beranek President and CEO Well certainly as we move up into the Regional Service Providers, we're coming up to the larger competitors on a more aggressive basis. And last year and the last couple of years during the COVID environment, when our competitors did not have capacity to respond to these providers, it gave us the opportunity to compete for business. And it's important for us during that period of time that we did not simply take orders. I wanted share, I wanted the opportunity for repeat business. And we did a number of trials to facilitate and identify the labor savings, and how we could be long term customers, long term suppliers into that environment. Now larger service providers typically, are going to lower gross profit than Community Broadband. But that will be hidden in our numbers moving forward. Because of the overhead absorption was going to be at a level that it'll hide the increased margin that we would normally see by a straight Community Broadband business. Greg Mesniaeff WestPark Capital Thank you for that. And then one final, any commentary or color on use of proceeds from your raise. 33
Cheri Beranek PRESIDENT & CEO Dan Herzog CHIEF FINANCIAL OFFICER Q&A 34 Kevin Morgan CHIEF MARKETING OFFICER Cheri Beranek President and CEO We were very fortunate to be in a position to raise money last winter. And our balance sheet being very strong and has given us that the opportunity to really look at a variety of factors. Certainly in a time of uncertainty like now, having a strong balance sheet gives us a lot of considerations. It allows us to compete for big business and bigger customers. And it also allows us the opportunity to strategically look at opportunities to expand our product lines or to expand the channels by which we offer them. So no definitive plans at this point. But we are looking and managing our balance sheet with a very disciplined orientation. Greg Mesniaeff WestPark Capital Thank you. Operator This concludes our question - and - answer session. I would like to turn the conference back over to Cheri Beranek for any closing remarks. Cheri Beranek President and CEO Thank you very much. It's certainly been a challenging time and I take it very personally to disappoint investors in that your support and confidence in us is something that we take great pride in. I believe in this company, I believe in everything that we're doing, and I look forward to continue to earn your respect and your trust moving forward. Operator The conference is now concluded. Thank you for attending today's presentation. You may now disconnect. 34
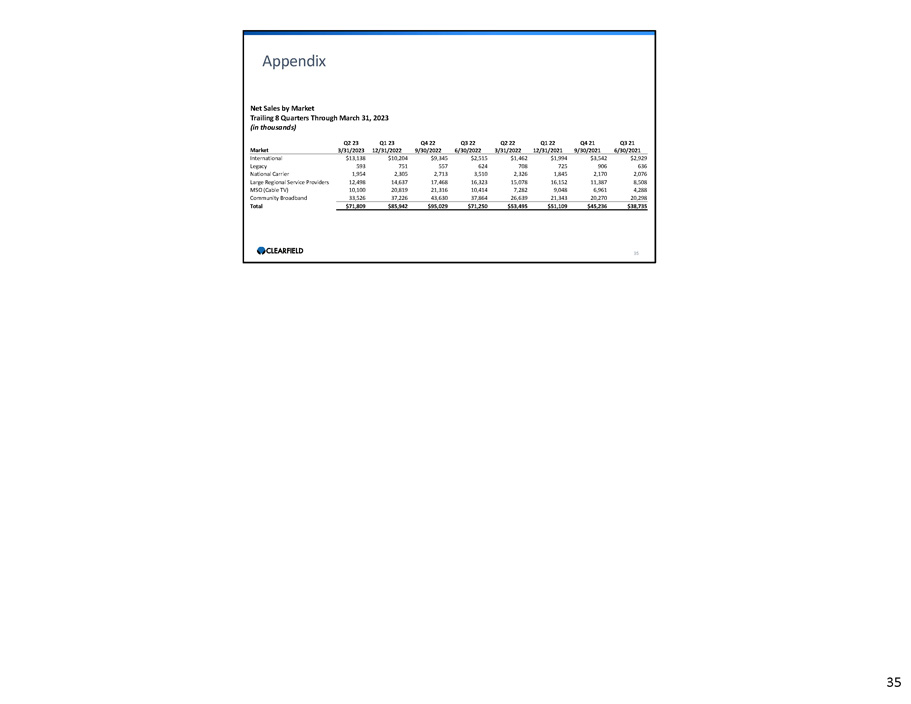
35 Appendix Q4 22 Q3 22 Q2 22 Q1 22 Q4 21 Q3 21 Net Sales by Market Trailing 8 Quarters Through March 31, 2023 (in thousands) Q2 23 Q1 23 Market 3/31/2023 12/31/2022 9/30/2022 6/30/2022 3/31/2022 12/31/2021 9/30/2021 6/30/2021 $2,929 $3,542 $1,994 $1,462 $2,515 $9,345 $10,204 $13,138 International 636 906 725 708 624 557 751 593 Legacy 2,076 2,170 1,845 2,326 3,510 2,713 2,305 1,954 National Carrier 8,508 11,387 16,152 15,078 16,323 17,468 14,637 12,498 Large Regional Service Providers 4,288 6,961 9,048 7,282 10,414 21,316 20,819 10,100 MSO (Cable TV) 33,526 37,226 43,630 37,864 26,639 21,343 20,270 20,298 $71,809 $85,942 $95,029 $71,250 $53,495 $51,109 $45,236 $38,735 Community Broadband Total 35
36 Contact Us COMPANY CONTACT: Cheri Beranek President & CEO Clearfield, Inc. IR@seeclearfield.com INVESTOR RELATIONS: The Blueshirt Group Greg McNiff T: 773 - 485 - 7191 clearfield@blueshirtgroup.com 36