
Exhibit 99.2
Clearfield Earnings Presentation: Fiscal Q3 2023 Earnings Call August 3, 2023 1

Important Cautions Regarding Forward - Looking Statements 2 Forward - looking statements contained herein and in any related presentation or in the related Earnings Release are made pursuant to the safe harbor provisions of the Private Litigation Reform Act of 1995. Words such as “may,” “will,” “expect,” “believe,” “anticipate,” “estimate,” “outlook,” or “continue” or comparab le terminology are intended to identify forward - looking statements. Such forward looking statements include, for example, statements about the Company’s future revenue and operating performance , expected customer ordering patterns, anticipated shipping on backlog and future lead times, future availability of components and materials from the Company’s supply chain, future ava ila bility of labor impacting our customers’ network builds, the impact of the Rural Digital Opportunity Fund (RDOF) or other government programs on the demand for the Company’s products or tim ing of customer orders, the Company’s ability to match capacity to meet demand, expansion into new markets and trends in and growth of the FTTx markets, market segments or customer purchases and other statements that are not historical facts. These statements are based upon the Company's current expectations and judgments about future developments in the Company's b usi ness. Certain important factors could have a material impact on the Company's performance, including, without limitation: the COVID - 19 pandemic has significantly impacted worldwide e conomic conditions and could have a material adverse effect on our business, financial condition and operating results; inflationary price pressures and uncertain availability of compon ent s, raw materials, labor and logistics used by us and our suppliers could negatively impact our profitability; we rely on single - source suppliers, which could cause delays, increase costs or preve nt us from completing customer orders; we depend on the availability of sufficient supply of certain materials and global disruptions in the supply chain for these materials could p rev ent us from meeting customer demand for our products; we rely on our manufacturing operations to produce product to ship to customers and manufacturing constraints and disruptions could resu lt in decreased future revenue; a significant percentage of our sales in the last three fiscal years have been made to a small number of customers, and the loss of these major customers cou ld adversely affect us; further consolidation among our customers may result in the loss of some customers and may reduce sales during the pendency of business combinations and related integr ati on activities; we may be subject to risks associated with acquisitions, and the risks could adversely affect future operating results; we have exposure to movements in foreign currenc y e xchange rates; if we are unable to integrate acquired businesses, our financial results could be materially and adversely affected; adverse global economic conditions and geopolitical issues cou ld have a negative effect on our business, and results of operations and financial condition; our planned growth may strain our business infrastructure, which could adversely affect our operatio ns and financial condition; product defects or the failure of our products to meet specifications could cause us to lose customers and sales or to incur unexpected expenses; we are dependent on key personnel; cyber - security incidents on our information technology systems, including ransomware, data breaches or computer viruses, could disrupt our business operations, damage ou r r eputation, and potentially lead to litigation; our business is dependent on interdependent management information systems; to compete effectively, we must continually improve existing prod uct s and introduce new products that achieve market acceptance; if the telecommunications market does not continue to expand, our business may not grow as fast as we expect, whi ch could adversely impact our business, financial condition and operating results; changes in U.S. government funding programs may cause our customers and prospective customers to delay, re duc e, or accelerate purchases, leading to unpredictable and irregular purchase cycles; intense competition in our industry may result in price reductions, lower gross profits and loss o f m arket share; our success depends upon adequate protection of our patent and intellectual property rights; we face risks associated with expanding our sales outside of the United States; and oth er factors set forth in Part I, Item IA. Risk Factors of Clearfield's Annual Report on Form 10 - K for the year ended September 30, 2022 as well as other filings with the Securities and Exchange Commi ssion. The Company undertakes no obligation to update these statements to reflect actual events unless required by law. © Copyright 2023 Clearfield, Inc. All Rights Reserved.

3 Enabling the lifestyle better broadband provides
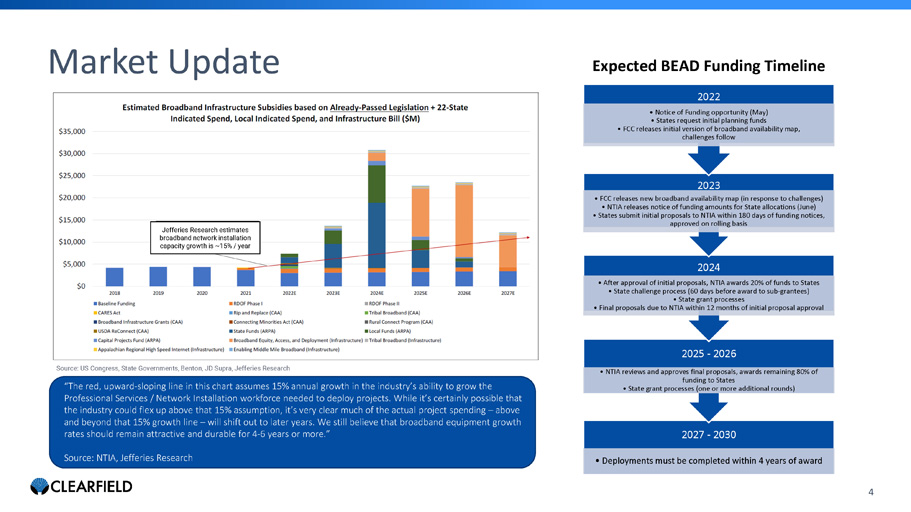
Market Update 4 “The red, upward - sloping line in this chart assumes 15% annual growth in the industry’s ability to grow the Professional Services / Network Installation workforce needed to deploy projects. While it’s certainly possible that the industry could flex up above that 15% assumption, it’s very clear much of the actual project spending – above and beyond that 15% growth line – will shift out to later years. We still believe that broadband equipment growth rates should remain attractive and durable for 4 - 6 years or more.” Source: NTIA, Jefferies Research 2027 - 2030 • Deployments must be completed within 4 years of award 2025 - 2026 • NTIA reviews and approves final proposals, awards remaining 80% of funding to States • State grant processes (one or more additional rounds) 2024 • After approval of initial proposals, NTIA awards 20% of funds to States • State challenge process (60 days before award to sub - grantees) • State grant processes • Final proposals due to NTIA within 12 months of initial proposal approval 2023 • FCC releases new broadband availability map (in response to challenges) • NTIA releases notice of funding amounts for State allocations (June) • States submit initial proposals to NTIA within 180 days of funding notices, approved on rolling basis 2022 • Notice of Funding opportunity (May) • States request initial planning funds • FCC releases initial version of broadband availability map, challenges follow Expected BEAD Funding Timeline Jefferies Research estimates broadband network installation capacity growth is ~15% / year Source: US Congress, State Governments, Benton, JD Supra, Jefferies Research

5 Financial Performance

Quarterly Revenue $71 $88 $78 $61 $48 $- $10 $20 $30 $40 $50 $60 $70 $80 $90 $100 Q3 22 Q4 22* Q1 23* Q2 23* Q3 23* Clearfield Organic Nestor Cables FINANCIAL PERFORMANCE 18% Nestor Cables Contribution compared to prior quarter $ 61 M Q3 2023 Revenue 6 $95 $ 86 $72 All dollar figures in millions *Includes contribution from subsidiary Nestor Cables, which was acquired on July 26, 2022 $ 61

NASDAQ:CLFD $10 $3 $10 $59 $34 $105 $47 $3 $9 $60 $62 $133 International Legacy National Carrier Large Regional MSO/Cable TV Community Broadband FQ3 22 FQ3 23 Q3 FY23 Net Sales Comparison by Market TTM Net Sales All dollar figures in millions 1) Based on net sales of $72 million for Clearfield (including an $11M contribution from Nestor Cables within our international market) and Point of Sales (POS) reporting from distributors who resell our product line into these markets. Q3 FY23 Net Sales Composition Ended 6/30/23 1 Legacy (Legacy contract manufacturing and misc. sales) 23% 1% 3% 26% 15% 32% Community Broadband (Tier 2&3, utilities, municipalities, and alternative carriers) MSO (Cable TV) International (Europe, Canada, Mexico, and Caribbean Markets) 7 National Carrier (Tier 1 Wireline and all Wireless Markets) Large Regional Service Providers (ILEC operating a multi - state network with more than 500,000 subscribers)
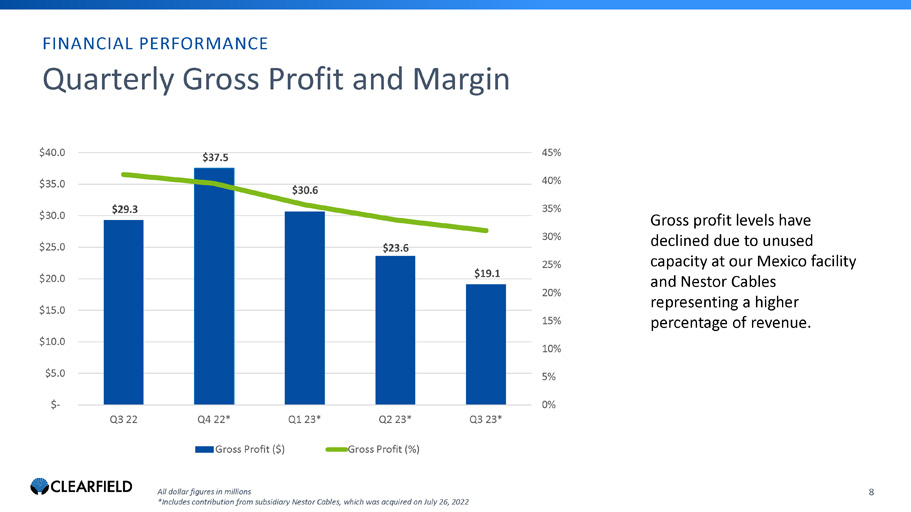
Quarterly Gross Profit and Margin $29.3 $37.5 $30.6 $23.6 $19.1 0% 5% 10% 15% 20% 25% 30% 35% 40% 45% $- $5.0 $10.0 $15.0 $20.0 $25.0 $30.0 $35.0 $40.0 Q3 22 Q4 22* Q1 23* Q2 23* Q3 23* Gross Profit ($) Gross Profit (%) FINANCIAL PERFORMANCE 8 Gross profit levels have declined due to unused capacity at our Mexico facility and Nestor Cables representing a higher percentage of revenue. All dollar figures in millions *Includes contribution from subsidiary Nestor Cables, which was acquired on July 26, 2022
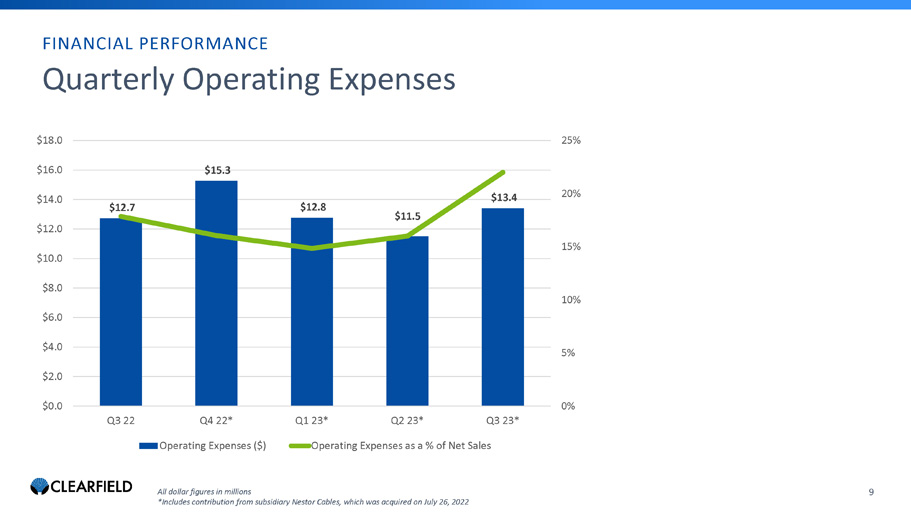
$12.7 $15.3 $12.8 $11.5 $13.4 0% 5% 10% 15% 20% 25% $0.0 $2.0 $4.0 $6.0 $8.0 $10.0 $12.0 $14.0 $16.0 $18.0 Q3 22 Q4 22* Q1 23* Q2 23* Q3 23* Operating Expenses ($) Operating Expenses as a % of Net Sales FINANCIAL PERFORMANCE 9 Quarterly Operating Expenses All dollar figures in millions *Includes contribution from subsidiary Nestor Cables, which was acquired on July 26, 2022
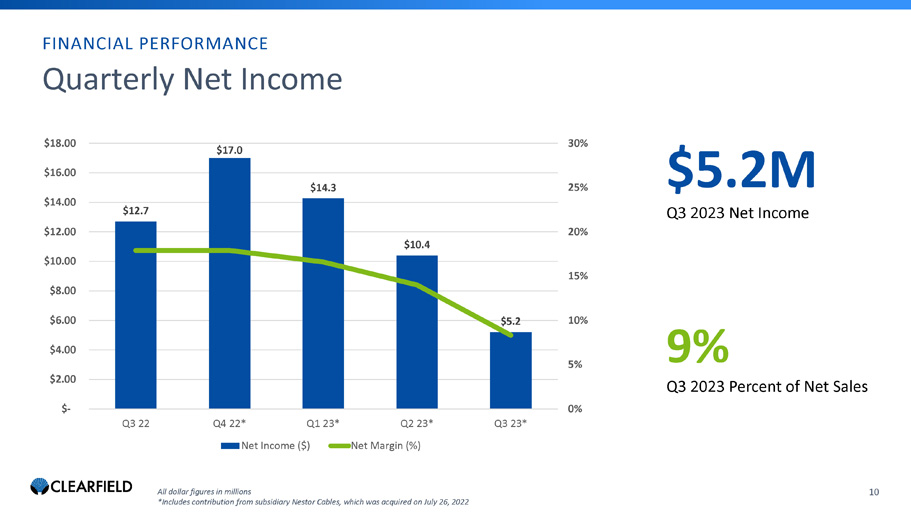
$12.7 $17.0 $14.3 $10.4 $5.2 0% 5% 10% 15% 20% 25% 30% $- $2.00 $4.00 $6.00 $8.00 $10.00 $12.00 $14.00 $16.00 $18.00 Q3 22 Q4 22* Q1 23* Q2 23* Q3 23* Net Income ($) Net Margin (%) $5 .2 M Q3 2023 Net Income 9% Q3 2023 Percent of Net Sales FINANCIAL PERFORMANCE 10 Quarterly Net Income All dollar figures in millions *Includes contribution from subsidiary Nestor Cables, which was acquired on July 26, 2022
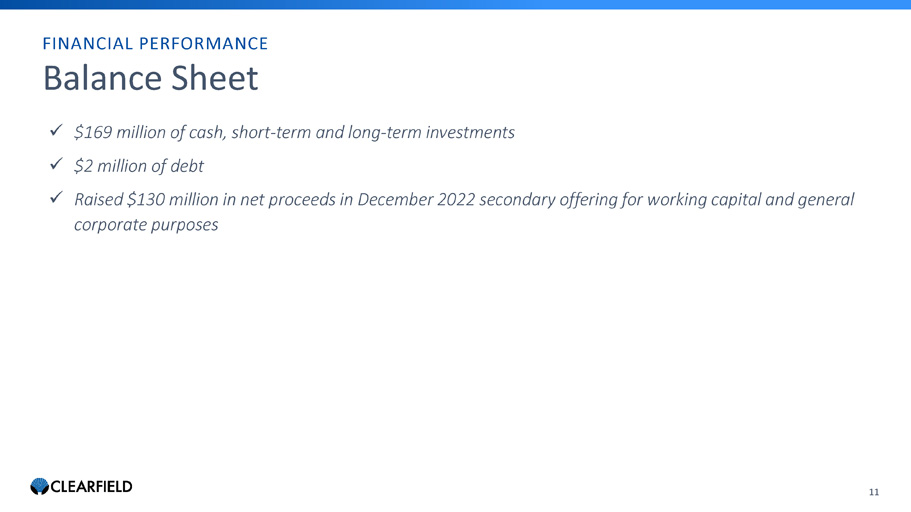
Balance Sheet FINANCIAL PERFORMANCE 11 x $169 million of cash, short - term and long - term investments x $2 million of debt x Raised $130 million in net proceeds in December 2022 secondary offering for working capital and general corporate purposes
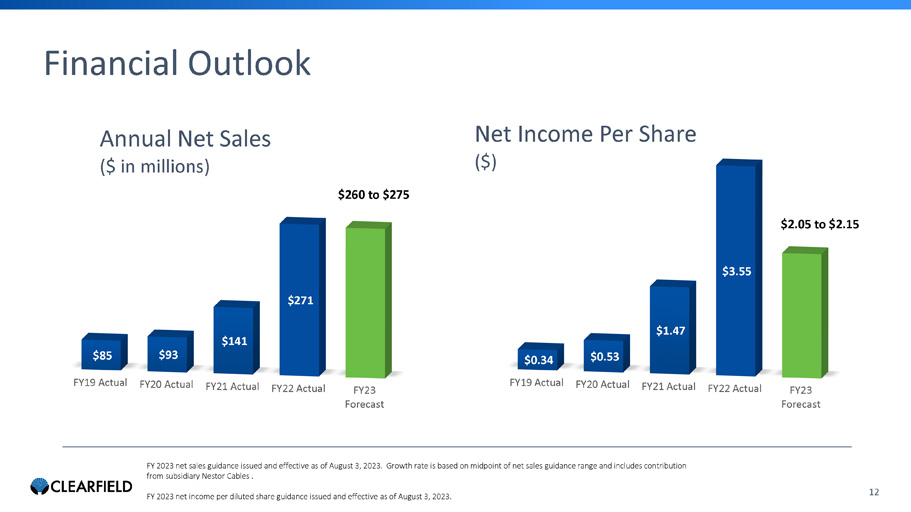
FY19 Actual FY20 Actual FY21 Actual FY22 Actual FY23 Forecast $85 $93 $141 $271 $260 to $275 NASDAQ:CLFD FY 2023 net sales guidance issued and effective as of August 3 , 2023. Growth rate is based on midpoint of net sales guidance range and includes contribution from subsidiary Nestor Cables . FY 2023 net income per diluted share guidance issued and effective as of August 3 , 2023. Annual Net Sales ($ in millions) 12 Financial Outlook $380 - $393 FY19 Actual FY20 Actual FY21 Actual FY22 Actual FY23 Forecast $0.34 $0.53 $1.47 $3.55 $2.05 to $2.15 Net Income Per Share ($)

13 Business Update
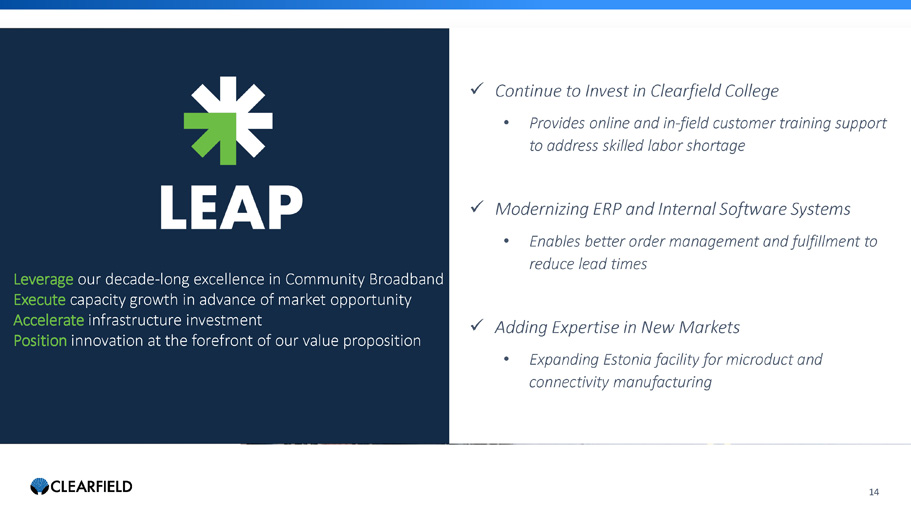
14 Leverage our decade - long excellence in Community Broadband Execute capacity growth in advance of market opportunity Accelerate infrastructure investment Position innovation at the forefront of our value proposition x Continue to Invest in Clearfield College • Provides online and in - field customer training support to address skilled labor shortage x Modernizing ERP and Internal Software Systems • Enables better order management and fulfillment to reduce lead times x Adding Expertise in New Markets • Expanding Estonia facility for microduct and connectivity manufacturing

Cheri Beranek PRESIDENT & CEO Dan Herzog CHIEF FINANCIAL OFFICER Q&A 15 Kevin Morgan CHIEF MARKETING OFFICER
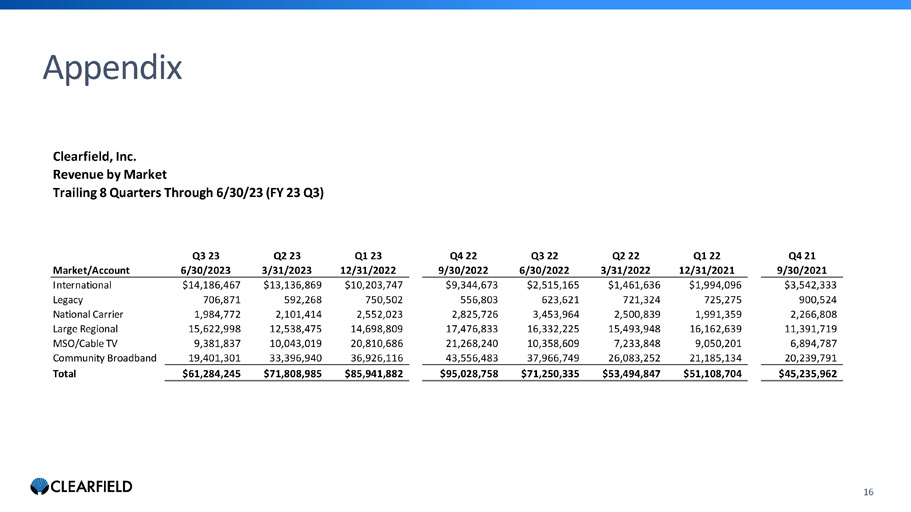
NASDAQ:CLFD 16 Appendix Clearfield, Inc. Revenue by Market Trailing 8 Quarters Through 6/30/23 (FY 23 Q3) Market/Account Q3 23 6/30/2023 Q2 23 3/31/2023 Q1 23 12/31/2022 Q4 22 9/30/2022 Q3 22 6/30/2022 Q2 22 3/31/2022 Q1 22 12/31/2021 Q4 21 9/30/2021 International $14,186,467 $13,136,869 $10,203,747 $9,344,673 $2,515,165 $1,461,636 $1,994,096 $3,542,333 Legacy 706,871 592,268 750,502 556,803 623,621 721,324 725,275 900,524 National Carrier 1,984,772 2,101,414 2,552,023 2,825,726 3,453,964 2,500,839 1,991,359 2,266,808 Large Regional 15,622,998 12,538,475 14,698,809 17,476,833 16,332,225 15,493,948 16,162,639 11,391,719 MSO/Cable TV 9,381,837 10,043,019 20,810,686 21,268,240 10,358,609 7,233,848 9,050,201 6,894,787 Community Broadband 19,401,301 33,396,940 36,926,116 43,556,483 37,966,749 26,083,252 21,185,134 20,239,791 Total $61,284,245 $71,808,985 $85,941,882 $95,028,758 $71,250,335 $53,494,847 $51,108,704 $45,235,962

17 Contact Us COMPANY CONTACT: Cheri Beranek President & CEO Clearfield, Inc. IR@seeclearfield.com INVESTOR RELATIONS: The Blueshirt Group Greg McNiff T: 773 - 485 - 7191 clearfield@blueshirtgroup.com