UNITED STATES
SECURITIES AND EXCHANGE COMMISSION
Washington, D.C. 20549
FORM 10-K
| [X] | Annual Report Pursuant to Section 13 or 15(d) of the Securities Exchange Act of 1934 |
For the fiscal year ended September 30, 2015.
| [_] | Transition Report Pursuant to Section 13 or 15(d) of the Securities Exchange Act of 1934 |
For the transition period from ______________ to _______________.
Commission File Number 0-16106
CLEARFIELD, INC.
(Exact Name of Registrant as Specified in its Charter)
| Minnesota | 41-1347235 | |
| (State of incorporation) | (I.R.S. Employer Identification No.) |
|
7050 Winnetka Avenue North Suite 100 Brooklyn Park, Minnesota 55428 |
(763) 476-6866 | |
| (Address of principal executive office) | Registrant’s telephone number, including area code |
Securities registered pursuant to Section 12(b) of the Act:
|
(Title of class) |
(Name of exchange on which registered) | |
| Common Stock, par value $.01 per share | The NASDAQ Stock Market LLC | |
| (Including Series B Junior Participating Preferred Share Purchase Rights) |
Securities registered pursuant to Section 12(g) of the Act:
NONE
Indicate by check mark if the registrant is a well-known seasoned issuer, as defined in Rule 405 of the Securities Act.
[_] YES [X] NO
Indicate by check mark if the registrant is not required to file reports pursuant to Section 13 or Section 15(d) of the Exchange Act.
[_] YES [X] NO
Indicate by check mark whether the registrant (1) has filed all reports required to be filed by Section 13 or 15(d) of the Securities Exchange Act of 1934 during the preceding 12 months (or for such shorter period that the registrant was required to file such reports), and (2) has been subject to such filing requirements for the past 90 days.
[X] YES [_] NO
Indicate by check mark whether the registrant has submitted electronically and posted on its corporate Web site, if any, every Interactive Data File required to be submitted and posted pursuant to Rule 405 of Regulation S-T (§ 232.405 of this chapter) during the preceding 12 months (or for such shorter period that the registrant was required to submit and post such files).
[X] YES [_] NO
Indicate by check mark if disclosure of delinquent filers pursuant to Item 405 of Regulation S-K (§ 229.405 of this chapter) is not contained herein, and will not be contained, to the best of registrant’s knowledge, in definitive proxy or information statements incorporated by reference in Part III of this Form 10-K or any amendment to this Form 10-K.
[X] YES [_] NO
Indicate by check mark whether the registrant is a large accelerated filer, an accelerated filer, a non-accelerated filer or a smaller reporting company as defined in Rule 12b-2 of the Exchange Act.
Large accelerated filer [_] Accelerated filer [X] Non-accelerated filer [_] Smaller Reporting Company [_]
Indicate whether the registrant is a shell company (as defined in Rule 12b-2 of the Act).
[_] YES [X] NO
The aggregate market value of the voting and non-voting equity held by non-affiliates of the registrant, as of the last business day of the registrant’s most recently completed second fiscal quarter computed by reference to the price at which the common equity was last sold was approximately $167,018,584.
The number of shares of common stock outstanding as of November 15, 2015 was 13,702,310.
Documents Incorporated by Reference:
Portions of our proxy statement for the 2016 Annual Meeting of Shareholders, to be filed within 120 days after the end of the fiscal year covered by this report, are incorporated by reference into Part III.
CLEARFIELD, INC.
ANNUAL REPORT ON FORM 10-K
TABLE OF CONTENTS
Background
Clearfield, Inc. (“Clearfield” or the “Company”) is a Minnesota corporation which was founded in 1979. Our corporate headquarters are located at 7050 Winnetka Avenue North, Suite 100, Brooklyn Park, Minnesota, 55428, and our corporate website is www.clearfieldconnection.com. The information available on our website is not part of this Report. You can access, free of charge, our filings with the Securities and Exchange Commission, including our annual report on Form 10-K, our quarterly reports on Form 10-Q, current reports on Form 8-K and any other amendments to those reports, through the “About Clearfield” link at our website, or at the Commission’s website at www.sec.gov.
Description of Business
Clearfield, Inc. manufactures, markets and sells an end-to-end fiber management and enclosure platform that consolidates, distributes and protects fiber as it moves from the inside plant to the outside plant and all the way to the home, business and cell site. The Company has extended this product line with a fiber delivery platform of optical cable, connectors and microduct that delivers fiber to environments previously not economically or environmentally viable. The Company has successfully established itself as a value-added supplier to its target market of broadband service providers, including independent local exchange carriers (“ILEC”) (telephone), multiple service operators (cable), wireless service providers, competitive local exchange carriers (“CLEC”) and municipal-owned utilities. Clearfield has continued to expand its product offerings and broaden its customer base during its years of operations.
By aligning its in-house engineering and technical knowledge alongside its customers’ needs, the Company has been able to develop, customize and enhance products from design through production. Substantially all of the final build and assembly is completed at Clearfield’s plants in Brooklyn Park, Minnesota and Mexico, with manufacturing support from a network of domestic and global manufacturing partners. Clearfield specializes in producing these products on both a quick-turn and scheduled delivery basis. The Company deploys a hybrid sales model with some sales made directly to the customer, some made through two-tier distribution partners and some sales through original equipment suppliers who private label its products.
Products
Clearview Cassette
The Clearview™ Cassette, a patented technology, is the main building block of the Company’s product platform. The value of the building block approach is that Clearfield is the only company to provide the needs of every leg of the telecommunications network with a single building block architecture, reducing the customers’ cost of deployment by reducing labor costs associated with training and reducing inventory carrying costs.
Clearview Classic and Clearview Blue: Clearview Classic and Clearview Blue, is a system of five parts that nest together in the cassette’s main housing to support a wide range of applications. Parts can be added or removed as needed to support the environment in which it is deployed. Clearview Blue, while fully compatible with Clearview Classic, is designed for the utmost in modularity and scalability. It builds upon the Clearview Classic by offering a smaller footprint and integrated slack storage and splicing functionality.
| 1 |
Clearview xPAK: Engineered to land small port count fiber terminations and optical components, the patented xPAK is shipped flat and unassembled. Following simple pictorial user instructions, a technician will assemble the device to match his field requirements at the installation site. Application environments include cell back-haul, business class service delivery, node segmentation, fiber exhaust scenarios, utility sub-stations or fiber-to-the-desk deployment.
Connectivity and Optical Components
The Clearview system consolidates, distributes and protects fibers as they move from the inside plant to the home and business. These fibers are either connectorized directly for cable-to-cable deployment or are connectorized onto optical components that may amplify or divide the signals they carry. We provide products that meet a customer’s cable-to-cable deployment or optical component needs.
Cable-to-Cable Deployment: Fiber Deep is a class of
fiber assemblies that guarantees performance at .2dB insertion loss – fully half that of the industry standard. This metric
extends the link loss budget effectively, extending the distance upon which fiber can be deployed. In addition, this 2dB improvement
in optical budget reduces power consumption by 10%. The power savings, multiplied by even a small thousand home network, is a significant
contribution to a community’s “go-green” efforts.
Optical Components: Clearfield packages optical components for signal coupling, splitting, termination, multiplexing, demultiplexing and attenuation for a seamless integration within its fiber management platform. This value-added packaging allows the customer to source from a single supplier and reduces space requirements. The products are built and tested to meet the strictest industry standards ensuring customers trouble-free performance in extreme outside plant environments.
FieldSmart
Utilizing the Clearview Cassette and xPAK as building blocks, FieldSmart is a series of panels, cabinets, wall boxes and other enclosures that house the Clearview components to provide a consistent design from the inside plant of the telco’s “central office” or cable television’s “head-end”, all the way through the outside plant to the access network and through to the home. At each leg of the network, the FieldSmart platform delivers a modular and scalable architecture that allows the service provider to align their capital equipment expenditures alongside their subscriber revenues.
Inside Plant: The FieldSmart Fiber Crossover Distribution System (“FxDS”) and high density FieldSmart FxHD provides complete fiber management modularity and scalability across the fiber network. Using the Clearview building block approach, each fiber management element provides modularity of physical fiber protection in the environment in which it is placed. Easily configured for initial placement and scaling from 12-ports to a full rack of 1728-ports, the FieldSmart FxDS requires only four unique blocks to configure initial deployment. The user then places what is needed on the frame as subscriber take rates dictate. The FxHD is an integrated fiber management solution delivered via the Clearview Blue Cassette. With instant access to all cassettes, adapters, and jumpers, the frame is designed as a front access frame, meaning all installation is done from one side of the frame providing the option to reclaim the aisle space required for frame solutions that require rear access – and to use that space for other equipment or more frames. The FxHD can be placed against a wall, cage in data center co-location environments, or back to back.
Outside Plant: The FieldSmart Fiber Scalability Center (“FSC”) is a modular and scalable outside plant cabinet that allows rollout of Fiber-to-the-Premise services by communication service providers without a large initial expense. Each outside plant cabinet stores feeder and distribution splices, splitters, connectors and slack cable neatly and compactly, utilizing field-tested designs to maximize bend radius protection, connector access, ease of cable routing and physical protection, thereby minimizing the risk of fiber damage. The FSC product, with the Clearview cassette at its heart, has been designed to scale with the application environment as demand requires and to reduce service turn-up time for the end-user.
| 2 |
Access Network: FieldSmart Fiber Delivery Point (“FDP”) is a series of enclosure systems that incorporates the delivery of fiber connectivity to the neighborhood or business district in the most cost-effective footprint possible. This family of wall-mount enclosures provides 12 to 144 ports of connectivity for multi-dwelling unit fiber deployments, fiber demarcation, security systems (CCTV), telecommunications room needs and horizontal/intermediate cross-connects.
Access Network: FieldSmart Small Count Delivery (“SCD”) is a series of enclosure systems that are packaged to make landing small count fiber more cost-effective and efficient than previously thought possible. This family of wall-mount enclosures, panels and drop cable cases provide up to 12 ports of connectivity when fiber management is critical but high-count density is required. The FieldSmart SCD is targeted for application environments such as cell backhaul, business class service delivery, node segmentation, fiber exhaust in a field pedestal, sub-station turn-up or fiber-to-the-desk deployment.
FieldShield
FieldShield is a patent-pending fiber delivery method aimed at reducing the cost of broadband deployment. FieldShield takes industry standard glass and makes it easier and less expensive to install. FieldShield starts with a ruggedized microduct designed to support all aerial, direct bury, and inside plant “last mile” needs. Created from the most rugged HDPE polymers, FieldShield Microduct is strong enough to be placed using traditional methods of boring and plowing, leveraging existing conduit placement equipment, as well as newer, less disruptive technologies such as micro trenching or saw cutting.
FieldShield Pushable Fiber easily slips through the microduct's smooth inner wall. Utilizing bend-insensitive glass, FieldShield Pushable Fiber is available in a variety of fiber counts: 1 to 12 fibers in a 3mm jacket and up to 24 fibers in a 4mm jacket. Available in bulk reels or factory terminated, FieldShield offers total installation flexibility. FieldShield Pushable Fiber can be pushed by hand up to 100 feet or to distances up to 500 feet for direct bury applications and 300 feet for plenum and riser environments with the use of the FieldShield Assist Module, Clearfield’s cordless drill-driven machine. A factory pre-connectorized FieldShield Pushable Connector eliminates costly labor in the field and presents reliable, consistent and guaranteed performance along with lower installation costs. After being installed in the microduct, the slip-resistant protective housing is removed and the connector snaps together - all in seconds, providing a cost-effective, tech-friendly means of installing optical fiber without jeopardizing fiber protection.
The FieldShield Multiport SmarTerminal extends the reach of FieldShield optical fiber to the hardened connector marketplace. Teaming a FieldShield Pushable Connector with a field-installable, tool-less smart housing that provides a water tight seal decreases installation and maintenance time, while providing superior durability and reliability in the drop segment of the network. These new solutions, FieldShield Hardened Connectors and the FieldShield Multiport SmarTerminal, bring together the advantages of hardened connector technology with the ease of use and cost reductions associated with pushable fiber.
CraftSmart
CraftSmart is a full line of optical protection field enclosures, extending Clearfield presence in the fiber industry. The CraftSmart Fiber Protection Pedestals (“FPP”) and CraftSmart Fiber Protection Vaults (“FPV”) are integrated solutions, optimized to house FieldSmart products at the last mile access point of the network in above-grade or below-grade installations.
CraftSmart aims to optimize fiber protection and storage while ensuring industry standards. Utilizing methods of sealing and below-grade protection, along with Clearfield innovation, CraftSmart is a turn-key solution for the deployment of passive optics from the central office/head-end to the customer premise.
| 3 |
Cable Assemblies
Clearfield manufactures high quality fiber and copper assemblies with an industry-standard or customer-specified configuration. Industry-standard assemblies built include but are not limited to: single mode fiber, multimode fiber, multi-fiber, CATV node assembly, DS1 Telco, DS 3 (734/735) coax, Category 5e and 6, SCSI, Token Ring, and V.35. In addition, Clearfield’s engineering services team works alongside the engineering design departments of our original equipment manufacturer (“OEM”) customers to design and manufacture custom solutions for both in-the-box as well as network connectivity assemblies specific to that customer’s product line.
Markets
FTTP
Fiber to the Premise (also called Fiber to the Home) is a means of delivering the highest possible level of bandwidth directly to the user. The Company’s sales and marketing efforts have principally been focused on the U.S., with investments in Canada and the Caribbean regions added in recent years.
FTTB
Fiber to the Business is the rapid expansion of fiber services, principally by multiple service (cable TV) operators to penetrate the business marketplace.
FTT-Cell site
Fiber to the Cell site is the trend in which wireless service providers are re-focusing their efforts from building towers for coverage to enhancing their coverage for bandwidth. Fiber is the medium of choice for their upgrade. Currently, a very small percentage of these cell sites are served by fiber.
DAS
A distributed-antenna system, or DAS, is a network of spatially separated antenna nodes connected to a common source via a transport medium that provides wireless service within a geographic area or structure. DAS antenna elevations are generally at or below the clutter level and node installations are compact. Fiber may be used to backhaul data from the antenna.
Build to Print
In addition to a proprietary product line designed for the broadband service provider marketplace, Clearfield provides contract manufacturing services for original equipment manufacturers requiring copper and fiber cable assemblies built to their specification.
Competition
Competitors to the FieldSmart product lines include, but are not limited to, Corning Cabling Systems, Inc., OFS (Furukawa Electric North America, Inc.), AFL Telecommunications (a subsidiary of Fujikura Ltd.), Fujikura Ltd., Alcatel, Inc., and TE Connectivity, Inc. (formerly Tyco Electronics). Competitors to the CraftSmart product line include Emerson Network Power, a subsidiary of Emerson Electric Co., and Charles Industries, Ltd. Competitors to FieldShield include M2FX. Nearly all of these firms are substantially larger than Clearfield and as a result may be able to procure pricing for necessary components and labor at much lower prices. Clearfield believes that it has a competitive advantage with customers who can leverage the cost savings the Clearview Cassette can provide and those who require quick-turn, high-performance customized products, and that it is at competitive disadvantage with customers who principally seek large volume commodity products.
Sources of Materials and Outsourced Labor
Numerous purchased materials, components, and labor are used in the manufacturing of the Company’s products. Most of these are readily available from multiple suppliers. However, some components and outsourced labor are purchased from a single or a limited number of suppliers. The loss of access to some components and outsourced labor could have an adverse effect on our ability to deliver products on a timely basis and on our financial performance.
| 4 |
Major Customers and Financial Information about Geographic Areas
The following table summarizes customers comprising 10% or more of net sales for the years ended September 30, 2015, 2014, and 2013:
| Year Ended September 30, | ||||||||||||
| 2015 | 2014 | 2013 | ||||||||||
| Customer A | 25 | % | 19 | % | 19 | % | ||||||
| Customer B | * | 21 | % | 23 | % | |||||||
* Less than 10%
As of September 30, 2015, Customers C and A accounted for 17% and 14% of accounts receivable, respectively. As of September 30, 2014, Customer C accounted for 10% of accounts receivable.
The Company allocates sales from external customers to geographic areas based on the location to which the product is transported. Sales outside the United States are principally to Canada, Central and South America. The following table presents our domestic and international sales for each of the last three fiscal years:
| Year Ended September 30, | ||||||||||||
| 2015 | 2014 | 2013 | ||||||||||
| United States | $ | 55,324,000 | $ | 52,687,000 | $ | 50,358,000 | ||||||
| All Other Countries | 5,000,000 | 5,358,000 | 2,995,000 | |||||||||
| Total Net Sales | $ | 60,324,000 | $ | 58,045,000 | $ | 53,353,000 | ||||||
Patents and Trademarks
As of September 30, 2015, we had five patents granted and five patent applications pending inside the United States. We have also developed and are using trademarks and logos to market and promote our products, including Clearview®, FieldSmart®, FieldShield®, and CraftSmart.®
Backlog
Backlog reflects purchase order commitments for our products received from customers that have yet to be fulfilled. Backlog orders are generally shipped within three months. The Company had a backlog of $3,540,000, $3,340,000, and $8,638,000 as of September 30, 2015, 2014, and 2013, respectively.
Seasonality
We are affected by the seasonal trends in the industries we serve. We typically experience sequentially lower sales in our first and second fiscal year quarters, primarily due to customer budget cycles, deployment schedules, some customer geographical concentrations as well as standard vacation and holiday calendars. Sales usually reach a seasonal peak in our third and fourth fiscal quarters.
Product Development
Product development for Clearfield’s product line program has been conducted internally. We believe that the communication industry environment is constantly evolving and our success depends on our ability to anticipate and respond to these changes. Our focus is to analyze the environment and technology and work to develop products that simplify our customers’ business by developing innovative high quality products utilizing modular design wherever possible. Research and development are reflected in Selling, General & Administrative expenses and are not material to the overall expense total.
| 5 |
Employees
As of September 30, 2015, the Company had 182 full-time employees. We also employ seasonal, part-time employees and independent contractors. None of our employees are covered by any collective bargaining agreement. We believe our employee relations to be good.
Segment Reporting
The Company operates in a single reportable segment.
Our results of operations could be adversely affected now that the stimulus funds of the American Recovery and Reinvestment Act are fully allocated and projects are nearing completion.
The American Recovery and Reinvestment Act (the “ARRA”), widely known as the “Stimulus Bill,” was enacted in February 2009. The ARRA allocated $7.2 billion in grants, loans and loan guarantees for broadband/wireless initiatives for rural un-served and underserved geographies across the country, with these initiatives administered by several federal agencies. This funding is available to a wide variety of organizations, including our customers and prospective customers, to purchase and implement network infrastructure and services to improve broadband coverage. As part of the criteria established by the federal agencies administering these programs, the projects to be funded through the federal stimulus plan must be approved by the state or states in which the projects will be located.
All ARRA funding for these broadband/wireless initiatives was allocated to awarded applicants prior to the start of this fiscal year. The majority of these projects were nearing completion by the end of fiscal year 2013.
National Broadband Plan’s transitioning from the USF to the CAF program may cause our customers and prospective customers to delay or reduce purchases.
In October of 2011, the Federal Communications Commission approved the National Broadband Plan which called for the restructuring of the long-standing USF (Universal Service Fund). A key element of this program is the transition out of the USF program, which awards an operating subsidy to telecommunications companies providing service to high-cost serving areas, to the Connect America Fund (CAF) which would provide a capital expenditure subsidy for the build-out of the country’s broadband network. In addition, other universal service and inter-carrier compensation reforms scheduled to begin in the coming years will eliminate subsidies that carriers have traditionally relied upon to support service in high-cost, rural areas. Our customers or prospective customers may delay purchases until the financial impact to them from the transition to the CAF becomes clear. To the extent our customers or prospective customers receive reduced subsidies under the CAF, they may reduce the spending associated with their projects, delay projects, or not pursue projects. Any of these actions may result in reduced demand for our products with these customers or prospective customers.
A significant percentage of our sales in the last three fiscal years have been made to a small number of customers, and the loss of these major customers would adversely affect us.
In fiscal year 2015, Customer A comprised approximately 25% of net sales. In fiscal year 2014, Customers A and B comprised approximately 19% and 21%, respectively, of net sales. Additionally, in fiscal year 2013, Customers A and B comprised approximately 19% and 23%, respectively, of net sales. These customers purchase our products from time to time through purchase orders, and we do not have any agreement that obligates these major customers to purchase products in the future from us. The loss of any one or more of these customers, the substantial reduction, delay or cancellation in orders from any such customer or our inability to collect the accounts receivable from these customers, could have a material adverse effect on our business, financial position and results of operations.
| 6 |
Intense competition in our industry may result in price reductions, lower gross profits and loss of market share.
Competition in the telecommunications equipment and services industry is intense. Our competitors may have or could develop or acquire marketing, financial, development and personnel resources that exceed ours. Our ability to compete successfully will depend on whether we can continue to advance the technology of our products and develop new products, the acceptance of our products among our customers and prospective customers and our ability to anticipate customer needs in product development, as well as the price, quality and reliability of our products, our delivery and service capabilities and our control of operating expenses.
We cannot assure you that we will be able to compete successfully against our current or future competitors. Increased competition from manufacturers of telecommunications equipment such as ours may result in price reductions, lower gross profit margins, and increased discounts to customers and loss of market share and could require increased spending by us on research and development, sales and marketing and customer support.
Our results of operations could be adversely affected by economic conditions and the effects of these conditions on our customers’ businesses.
Adverse changes in economic conditions, including the recent recession in the United States, have resulted and may continue to result in lower spending among our customers and contribute to decreased sales to our distributors and customers. Further, our business may be adversely affected by factors such as downturns in economic activity in specific geographic areas or in the telecommunications industry; social, political or labor conditions; or adverse changes in the availability and cost of capital, interest rates, tax rates, or regulations. These factors are beyond our control, but may result in decreases in spending among customers and softening demand for our products. Declines in demand for our products will adversely affect our sales. Further, challenging economic conditions also may impair the ability of our customers to pay for products and services they have purchased. As a result, our cash flow may be negatively impacted and our allowance for doubtful accounts and write-offs of accounts receivable may increase.
Our operating results may fluctuate significantly from quarter to quarter, which may make budgeting for expenses difficult and may negatively affect the market price of our common stock.
Because many purchases by customers of our products relate to a specific customer project and are procured by the customer from time to time through purchase orders, the short-term demand for our products can fluctuate significantly and our ability to forecast sales accurately from quarter to quarter is limited. This fluctuation can be further affected by the long sales cycles necessary to obtain contracts to supply equipment for these projects, the availability of capital to fund our customers’ projects, changes, or delays in customer deployment schedules and the impact of the government regulation to encourage service to unserved or underserved communities, rural areas or other high cost areas on customer buying patterns. These long sales cycles may result in significant effort expended with no resulting sales or sales that are not made in the anticipated quarter. Demand for our projects will also depend upon the extent to which our customers and prospective customers initiate these projects and the extent to which we are selected to provide our equipment in these projects, neither of which can be assured. In addition, a sharp increase in demand could result in actual lead times longer than quoted, and a sharp decrease in demand could result in excess stock. These factors generally result in fluctuations, sometimes significant, in our operating results.
| 7 |
Other factors that may affect our quarterly operating results including:
| · | the volume and timing of orders from and shipments to our customers, particularly significant customers such as Customer A that accounted for 25%, 19% and 19% of sales in the years ending September 30, 2015, 2014 and 2013, respectively; |
| · | work stoppages and other developments affecting the operations of our customers; |
| · | the timing of and our ability to obtain new customer contracts and the timing of revenue recognition; |
| · | the timing of new product and service announcements; |
| · | the availability of products and services; |
| · | market acceptance of new and enhanced versions of our products and services; |
| · | variations in the mix of products and services we sell; |
| · | the utilization of our production capacity and employees; |
| · | the availability and cost of key components of our products; and |
| · | changes in the valuation allowance relating to our deferred tax assets and the resulting income tax benefits or expenses. |
Further, we budget our expenses based in part on expectations of future sales. If sales levels in a particular quarter are lower than expected, our operating results will be affected adversely.
Because of these factors, our quarterly operating results are difficult to predict and are likely to vary in the future. If our operating results are below financial analysts’ or investors’ expectations, the market price of our common stock may fall abruptly and significantly.
To compete effectively, we must continually improve existing products and introduce new products that achieve market acceptance.
The telecommunications equipment industry is characterized by rapid technological changes, evolving industry standards, changing market conditions and frequent new product and service introductions and enhancements. The introduction of products using new technologies or the adoption of new industry standards can make our existing products, or products under development, obsolete or unmarketable. In order to remain competitive and increase sales, we will need to anticipate and adapt to these rapidly changing technologies, enhance our existing products and introduce new products to address the changing demands of our customers.
Many of our competitors have greater engineering and product development resources than we have. Although we expect to continue to invest resources in product development activities, our efforts to achieve and maintain profitability will require us to be selective and focused with our research and development expenditures. Further, our existing and development-stage products may become obsolete if our competitors introduce newer or more appealing technologies. If these technologies are patented or proprietary to our competitors, we may not be able to access these technologies.
If we fail to anticipate or respond in a cost-effective and timely manner to technological developments, changes in industry standards or customer requirements, or if we experience any significant delays in product development or introduction, our business, operating results and financial condition could be affected adversely.
| 8 |
We may face circumstances in the future that will result in impairment charges, including, but not limited to, significant goodwill impairment charges.
If the fair value of any of our long-lived assets decreases as a result of an economic slowdown, a downturn in the markets where we sell products and services or a downturn in our financial performance and/or future outlook, we may be required to record an impairment charge on such assets, including goodwill.
We are required to test intangible assets with indefinite life periods for potential impairment annually and on an interim basis if there are indicators of a potential impairment. We also are required to evaluate amortizable intangible assets and fixed assets for impairment if there are indicators of a possible impairment. One potential indicator of impairment is the value of our market capitalization compared to our net book value. Significant declines in our market capitalization could require us to record material goodwill and other impairment charges. Impairment charges could have a negative impact on our results of operations and financial position, as well as on the market price of our common stock.
We rely on single-source suppliers, which could cause delays, increases in costs or prevent us from completing customer orders, all of which could materially harm our business.
We assemble our products using materials and components supplied by various subcontractors and suppliers. We purchase critical components for our products, including injected molded parts and connectors from third parties, some of whom are single- or limited-source suppliers. If any of our suppliers are unable to ship critical components, we may be unable to manufacture and ship products to our distributors or customers. If the price of these components increases for any reason, or if these suppliers are unable or unwilling to deliver, we may have to find another source, which could result in interruptions, increased costs, delays, loss of sales and quality control problems.
Further, the costs to obtain certain raw materials and supplies, such as fiber and copper cabling, are subject to price fluctuations, which may be substantial, because of global market demands. Many companies utilize the same raw materials and supplies in the production of their products as we use in our products. Companies with more resources than us may have a competitive advantage in obtaining raw materials and supplies due to greater purchasing power. Some raw materials or supplies may be subject to regulatory actions, which may affect available supplies. Furthermore, due to general economic conditions in the United States and globally, our suppliers may experience financial difficulties, which could result in increased delays, additional costs, or loss of a supplier.
The termination or interruption of any of these relationships, or the failure of these manufacturers or suppliers to supply components or raw materials to us on a timely basis or in sufficient quantities, likely would cause us to be unable to meet orders for our products and harm our reputation and our business. Identifying and qualifying alternative suppliers would take time, involve significant additional costs and may delay the production of our products. If we fail to forecast our manufacturing requirements accurately or fail to properly manage our inventory with our contract manufacturers, we could incur additional costs, experience manufacturing delays and lose sales. Further, if we obtain a new supplier or assemble our product using an alternative source of supply, we may need to conduct additional testing of our products to ensure the product meets our quality and performance standards. Any delays in delivery of our product to distributors or customers could be extended, and our costs associated with the change in product manufacturing could increase.
The failure of our third-party manufacturers to manufacture the products for us, and the failure of our suppliers of components and raw materials to supply us consistent with our requirements as to quality, quantity and timeliness could materially harm our business by causing delays, loss of sales, increases in costs and lower gross profit margins.
| 9 |
We face risks associated with expanding our sales outside of the United States.
We believe that our future growth depends in part upon our ability to increase sales in international markets. These sales are subject to a variety of risks, including fluctuations in currency exchange rates, tariffs, import restrictions and other trade barriers, unexpected changes in regulatory requirements, longer accounts receivable payment cycles, potentially adverse tax consequences, and export license requirements. In addition, we are subject to the risks inherent in conducting business internationally, including political and economic instability and unexpected changes in diplomatic and trade relationships. Currency fluctuations may also increase the relative price of our product in international markets and thereby could also cause our products to become less affordable or less price competitive than those of international manufacturers. These risks associated with international operations may have a material adverse effect on our revenue from or costs associated with international sales.
Our success depends upon adequate protection of our patent and intellectual property rights.
Our future success depends in part upon our proprietary technology. We attempt to protect our proprietary technology through patents, trademarks, copyrights and trade secrets. However, these legal means afford us only limited protection and may not adequately protect our rights or remedies to gain or keep any advantages we may have over our competitors. Accordingly, we cannot predict whether these protections will be adequate, or whether our competitors will develop similar technology independently, without violating our proprietary rights.
Our competitors, who may have or could develop or acquire significant resources, may make substantial investments in competing technologies, or may apply for and obtain patents that will prevent, limit, or interfere with our ability to manufacture or market our products. Further, although we do not believe that any of our products infringe the rights of others, third parties may in the future claim our products infringe on their rights, and these third parties may assert infringement claims against us in the future.
We may litigate to enforce patents issued to us and to defend against claimed infringement of the rights of others or to determine the ownership, scope, or validity of our proprietary rights and the rights of others. Any claim of infringement against us could involve significant liabilities to third parties, could require us to seek licenses from third parties, and could prevent us from manufacturing, selling or using our products. The occurrence of this litigation, or the effect of an adverse determination in any of this type of litigation, could have a material adverse effect on our business, financial condition and results of operations.
Our failure to protect or enforce our intellectual property rights could have a material adverse effect on our business, results of operations and financial condition.
Further consolidation among our customers may result in the loss of some customers and may reduce sales during the pendency of business combinations and related integration activities.
We believe consolidation among our customers in the future will continue in order for them to increase market share and achieve greater economies of scale. Consolidation has impacted our business as our customers focus on completing business combinations and integrating their operations. In connection with this merger and acquisition activity, our customers may postpone or cancel orders for our product based on revised plans for technology or network expansion pending consolidation activity. Customers integrating large-scale acquisitions may also reduce their purchases of equipment during the integration period, or postpone or cancel orders.
The impact of significant mergers among our customers on our business is likely to be unclear until sometime after such transactions are completed. After a consolidation occurs, a customer may choose to reduce the number of vendors from which it purchases equipment and may choose one of our competitors as its preferred vendor. There can be no assurance that we will continue to supply equipment to the surviving communications service provider after a business combination is completed.
| 10 |
We are dependent on key personnel.
Our failure to attract and retain skilled personnel could hinder the management of our business, our research and development, our sales and marketing efforts and our manufacturing capabilities. Our future success depends to a significant degree upon the continued services of key senior management personnel, including Cheryl Beranek, our Chief Executive Officer and John Hill, our Chief Operating Officer. We have employment agreements with Ms. Beranek and Mr. Hill that provide that if we terminate the employment of either executive without cause or if the executive terminates her or his employment for good reason, we would be required to make specified payments to them as described in their employment agreements. We have key person life insurance on Ms. Beranek and Mr. Hill. Further, our future success also depends on our continuing ability to attract, retain and motivate highly qualified managerial, technical and sales personnel. Our inability to retain or attract qualified personnel could have a significant negative effect and thereby materially harm our business and financial condition.
Product defects or the failure of our products to meet specifications could cause us to lose customers and sales or to incur unexpected expenses.
If our products do not meet our customers’ performance requirements, our customer relationships may suffer. Also, our products may contain defects or fail to meet product specifications. Any failure or poor performance of our products could result in:
| · | lack of or delayed market acceptance of our products; |
| · | delayed product shipments; |
| · | unexpected expenses and diversion of resources to replace defective products or identify and correct the source of errors; |
| · | damage to our reputation and our customer relationships; |
| · | delayed recognition of sales or reduced sales; and |
| · | product liability claims or other claims for damages that may be caused by any product defects or performance failures. |
Our products are often critical to the performance of telecommunications systems. Many of our supply agreements contain limited warranty provisions. If these contractual limitations are unenforceable in a particular jurisdiction or if we are exposed to product liability claims that are not covered by insurance, a claim could harm our business.
Our stock price has been volatile historically and may continue to be volatile. The price of our common stock may fluctuate significantly.
The trading price of our common stock has been and may continue to be subject to wide fluctuations. Our stock price may fluctuate in response to a number of events and factors, such as quarterly variations in operating results, announcements of technological innovations or new products by us or our competitors, changes in financial estimates and recommendations by securities analysts, the operating and stock price performance of other companies that investors may deem comparable to us, and new reports relating to trends in our markets or general economic conditions.
| 11 |
In addition, the stock market is subject to price and volume fluctuations that affect the market prices for companies in general, and small-capitalization, high-technology companies like us in particular. These broad market and industry fluctuations may adversely affect the price of our common stock, regardless of our operating performance. Further, any failure by us to meet or exceed the expectations of financial analysts or investors is likely to cause a decline in our common stock price. Further, recent economic conditions have resulted in significant fluctuations in stock prices for many companies, including Clearfield. We cannot predict when the stock markets and the market for our common stock may stabilize. In addition, although our common stock is listed on the NASDAQ Stock Market, our common stock has at times experienced low trading volume in our past. Limited trading volume subjects our common stock to greater price volatility and may make it difficult for our shareholders to sell shares at an attractive price.
Future sales of shares of our common stock in the public market may negatively affect our stock price.
Future sales of our common stock, or the perception that these sales could occur, could have a significant negative effect on the market price of our common stock. In addition, upon exercise of outstanding options, the number of shares outstanding of our common stock could increase substantially. This increase, in turn, could dilute future earnings per share, if any, and could depress the market value of our common stock. Dilution and potential dilution, the availability of a large amount of shares for sale, and the possibility of additional issuances and sales of our common stock may negatively affect both the trading price of our common stock and the liquidity of our common stock.
Anti-takeover provisions in our organizational documents, Minnesota law and other agreements could prevent or delay a change in control of our company.
Certain provisions of our articles of incorporation and bylaws, Minnesota law and other agreements may make it more difficult for a third-party to acquire, or discourage a third-party from attempting to acquire, control of our company, including:
| · | the provisions of our bylaws setting forth the advance notice and information requirements for shareholder proposals, including nominees for directors, to be considered properly brought before shareholders; |
| · | the right of our board of directors to establish more than one class or series of shares and to fix the relative rights and preferences of any such different classes or series; |
| · | the provisions of Minnesota law relating to business combinations and control share acquisitions; and |
| · | the provisions of our stock option plans allowing for the acceleration of vesting or payments of awards granted under the plans in the event of specified events that result in a “change in control” and provisions of agreements with certain of our executive officers requiring payments if their employment is terminated and there is a “change in control.” |
These measures could discourage or prevent a takeover of us or changes in our management, even if an acquisition or such changes would be beneficial to our shareholders. This may have a negative effect on the price of our common stock.
Compliance with changing regulation of corporate governance and public disclosure may result in additional expenses.
Keeping abreast of, and in compliance with, changing laws, regulations and standards relating to corporate governance and public company disclosure requirements, including the Sarbanes-Oxley Act of 2002 and in particular Section 404 of that Act relating to management certification of internal controls, new disclosures relating to “conflict minerals”, the regulations of the Securities and Exchange Commission and the rules of the NASDAQ Stock Market have required an increased amount of management attention and external resources. We intend to invest all reasonably necessary resources to comply with evolving corporate governance and public disclosure standards, and this investment may result in increased general and administrative expenses and a diversion of management time and attention from revenue-generating activities to compliance activities.
| 12 |
ITEM 1B. UNRESOLVED STAFF COMMENTS
Not applicable.
Clearfield leases a 70,771 square foot facility at 7050 Winnetka Avenue North, Brooklyn Park, Minnesota consisting of our corporate offices, manufacturing and warehouse space. The lease term is ten years and two months and commenced on January 1, 2015. However, upon proper notice and payment of a termination fee of approximately $214,000, the Company has a one-time option to terminate the lease effective as of the last day of the eighth year of the term after the Company commenced paying base rent.
There are no pending legal proceedings against or involving the Company for which the outcome is likely to have a material adverse effect upon its financial position or results of operations.
ITEM 4. MINE SAFETY DISCLOSURES
Not applicable.
| ITEM 5. | MARKET FOR REGISTRANT’S COMMON EQUITY, RELATED STOCKHOLDER MATTERS AND ISSUER PURCHASES OF EQUITY SECURITIES |
Our common stock is traded on The NASDAQ Global Market system of The NASDAQ Stock Market LLC under the symbol “CLFD.”
The following table sets forth the quarterly high and low sales prices for our common stock for each quarter of the past two fiscal years.
| Fiscal Year Ended September 30, 2015 | High | Low | ||||||
| Quarter ended December 31, 2014 | $ | 14.99 | $ | 10.82 | ||||
| Quarter ended March 31, 2015 | 15.54 | 11.21 | ||||||
| Quarter ended June 30, 2015 | 16.75 | 12.90 | ||||||
| Quarter ended September 30, 2015 | 20.28 | 12.76 | ||||||
| Fiscal Year Ended September 30, 2014 | High | Low | ||||||
| Quarter ended December 31, 2013 | $ | 20.67 | $ | 13.47 | ||||
| Quarter ended March 31, 2014 | 26.09 | 17.41 | ||||||
| Quarter ended June 30, 2014 | 24.84 | 14.56 | ||||||
| Quarter ended September 30, 2014 | 16.90 | 12.35 | ||||||
The foregoing prices reflect inter-dealer prices, without dealer markup, markdown, or commissions and may not represent actual transactions.
Approximate Number of Holders of Common Stock
There were approximately 276 holders of record of our common stock as of September 30, 2015.
| 13 |
Dividends
We have never paid cash dividends on our common stock. We currently intend to retain any earnings for use in our operations and do not intend in the foreseeable future to pay cash dividends on our common stock.
Stock Performance Graph
The information provided under this subsection shall not be deemed “filed” for purposes of Section 18 of the Securities Exchange Act of 1934, as amended (the Exchange Act), or incorporated by reference into any filing of Clearfield, Inc. under the Securities Act of 1933, as amended, or the Exchange Act, except as shall be expressly set forth by specific reference in such filing.
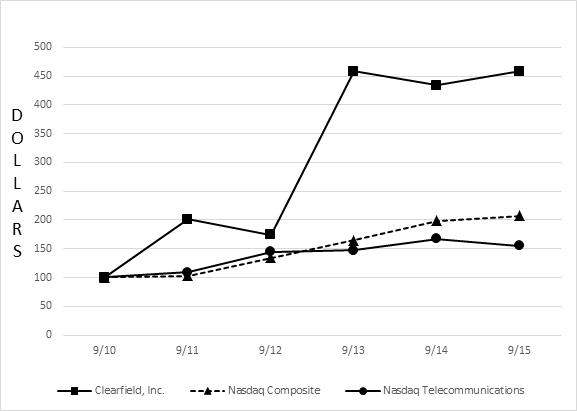
The following graph shows a comparison of the 5-year cumulative total return on Clearfield, Inc.’s common stock relative to the NASDAQ Composite index, which the Company has selected as a broad market index, and the NASDAQ Telecommunications index, which the Company has selected as a published industry index. The graph assumes an investment of $100 (with reinvestment of all dividends) is made in the Company’s common stock and in each index on September 30, 2010 and its relative performance is tracked through September 30, 2015. The returns shown are based on historical results and are not intended to suggest future performance.
COMPARISON OF 5-YEAR CUMULATIVE TOTAL RETURN*
Among Clearfield, Inc., The NASDAQ Stock Market Composite Index
And The NASDAQ Telecommunications Index
* $100 invested on September 30, 2010 in stock or index-including reinvestment
of dividends. Fiscal year ending September 30.
| 14 |
Equity Compensation Plan Information
The following table describes shares of our common stock that are available on September 30, 2015 for purchase under outstanding stock-based awards, or reserved for issuance under stock-based awards or other rights that may be granted in the future, under our equity compensation plans:
| Plan Category | Number of securities to be issued upon exercise of outstanding options, warrants and rights | Weighted-average exercise price of outstanding options, warrants and rights | Number of securities remaining available for future issuance under equity compensation plans (excluding those reflected in first column) | |||||||||
| Equity compensation plans approved by security holders | ||||||||||||
| 2007 Stock Compensation Plan | 297,384 | $ | 5.29 | 354,114 | ||||||||
| Total | 297,384 | $ | 5.29 | 354,114 | ||||||||
All outstanding equity awards have been granted pursuant to shareholder-approved plans. In addition to options, shares may be issued in the form of restricted stock awards and other stock-based awards.
Issuer Repurchases
The Company repurchased a total of 33,021 shares of our common stock during the fourth quarter of fiscal year 2015 in connection with payment of taxes upon the vesting of restricted stock previously issued to employees. The Company may also repurchase shares as a part of its stock repurchase program approved in November 2014 by which the Company’s Board of Directors authorized the repurchase of up to $8,000,000 of the Company’s common stock.
The following table presents the total number of shares repurchased during the fourth quarter of fiscal 2015 by month and the average price paid per share:
| ISSUER PURCHASES OF EQUITY SECURITIES | ||||||||||||||||
| Period | Total Number of Shares Purchased | Average Price Paid per Share | Total Number of Shares Purchased as Part of Publicly Announced Plans or Programs | Approximate Dollar Value of Shares that May Yet Be Purchased Under the Program (1) | ||||||||||||
| July 1-31, 2015 | — | $ | — | — | $ | — | ||||||||||
| August 1-31, 2015 | 33,021 | 16.93 | — | — | ||||||||||||
| September 1-30, 2015 | — | — | — | — | ||||||||||||
| Total | 33,021 | $ | 16.93 | — | $ | 7,150,843 | ||||||||||
| (1) | Amount remaining from the $8,000,000 repurchase authorization approved by the Company’s Board of Directors in November 2014. The program does not obligate Clearfield to repurchase any particular amount of common stock during any period. The repurchase will be funded by cash on hand. The repurchase program is expected to continue indefinitely until the maximum dollar amount of shares has been repurchased or until the repurchase program is earlier modified, suspended or terminated by the Board of Directors. |
| 15 |
ITEM 6. SELECTED FINANCIAL DATA
The following selected financial data has been derived from our financial statements and should be read in conjunction with the Financial Statements and related notes thereto set forth in Item 8 and with “Management’s Discussion and Analysis of Financial Condition and Results of Operations” included in Item 7 of this Annual Report on Form 10-K.
| Year Ended September 30 | ||||||||||||||||||||
| 2015 | 2014 | 2013 | 2012 | 2011 | ||||||||||||||||
| Selected Income Statement Data | ||||||||||||||||||||
| Net sales | $ | 60,323,917 | $ | 58,045,292 | $ | 53,353,080 | $ | 37,473,966 | $ | 35,192,532 | ||||||||||
| Gross profit | 24,867,953 | 24,598,766 | 21,989,578 | 15,285,721 | 14,658,358 | |||||||||||||||
| Income from operations | 7,051,355 | 8,518,126 | 7,444,735 | 4,274,881 | 3,716,209 | |||||||||||||||
| Income tax expense (benefit) | 2,475,238 | 3,180,978 | 2,803,172 | (3,324,299 | )* | (2,316,142 | )* | |||||||||||||
| Net income | 4,682,008 | 5,432,851 | 4,733,844 | 7,701,194 | 6,167,446 | |||||||||||||||
| Net income per share basic | $ | 0.35 | $ | 0.42 | $ | 0.38 | $ | 0.62 | $ | 0.51 | ||||||||||
| Net income per share diluted | $ | 0.34 | $ | 0.40 | $ | 0.36 | $ | 0.60 | $ | 0.48 | ||||||||||
| Selected Balance Sheet Data | ||||||||||||||||||||
| Total assets | $ | 57,627,617 | $ | 51,847,898 | $ | 46,413,339 | $ | 37,740,338 | $ | 30,302,091 | ||||||||||
| Long-term liabilities | 1,311,232 | - | 21,101 | 37,643 | 61,794 | |||||||||||||||
| Shareholders’ equity | 51,279,130 | 46,746,634 | 40,078,036 | 34,685,901 | 26,229,171 | |||||||||||||||
*During the fourth quarter of fiscal years 2012 and 2011, the Company reversed a substantial portion of a valuation allowance of the deferred tax assets in the amount of $3,518,000 and $2,481,000, respectively. These reversals increased our net income by that amount for each of the years ended September 30, 2012 and 2011 and contributed $0.28 and $0.19 per diluted share for the years, respectively.
| ITEM 7. | MANAGEMENT’S DISCUSSION AND ANALYSIS OF FINANCIAL CONDITION AND RESULTS OF OPERATIONS |
Cautionary Statement Regarding Forward-Looking Information
Statements made in this Annual Report on Form 10-K, in the Company’s other SEC filings, in press releases and in oral statements, that are not statements of historical fact are “forward-looking statements.” Such forward-looking statements involve known and unknown risks, uncertainties and other factors which may cause the actual results or performance of the Company to be materially different from the results or performance expressed or implied by such forward-looking statements. The words “believes,” “expects,” “anticipates,” “seeks” and similar expressions identify forward-looking statements. Readers are cautioned not to place undue reliance on these forward-looking statements, which speak only as of the date the statement was made. The risks and uncertainties that could cause actual results to differ materially and adversely from those expressed or implied by the forward-looking statements include those risks described in Part I, Item 1A “Risk Factors.”
Overview of Business: The Company sells highly configurable fiber management and connectivity products to broadband service providers serving the FTTP, FTTB, FTT-Cell site markets in the U.S. and in certain limited markets outside the U.S., currently countries in the Caribbean, Central America and South America. The Company’s sales channels include direct to customer, through distribution partners, and to original equipment suppliers who private label its products. The Company’s products are sold by its sales employees and independent sales representatives.
Critical Accounting Policies: In preparing our financial statements, we make estimates, assumptions and judgments that can have a significant impact on our sales, income or loss from operations and net income or loss, as well as on the value of certain assets and liabilities on our balance sheet. We believe that there are several accounting policies that are critical to an understanding of our historical and future performance, as these policies affect the reported amounts of sales, expenses and significant estimates and judgments applied by management. While there are a number of accounting policies, methods and estimates affecting our financial statements, areas that are particularly significant include:
| 16 |
| · | Revenue recognition; |
| · | Accounting for income taxes; |
| · | Valuation and evaluating impairment of long-lived assets and goodwill; and |
| · | Valuation of inventory. |
Revenue Recognition Revenue is recognized when persuasive evidence of an arrangement exists, the product has been delivered, the fee is fixed, acceptance by the customer is reasonably certain and collection is reasonably assured. This generally occurs upon shipment of product to the customer. Sales of the Company’s products are subject to limited warranty obligations that are included in the Company’s terms and conditions. Also, the Company offers limited discounts and rebates to customers which are recorded in net sales on an estimated basis as the sales are recognized. The Company records freight revenues billed to customers as sales and the related shipping and handling cost in cost of sales. Taxes collected from customers and remitted to governmental authorities are presented on a net basis.
Income Taxes We account for income taxes in accordance with Accounting Standards Codification (“ASC”) 740, Income Taxes, under which deferred income taxes are recognized based on the estimated future tax effects of differences between the financial statement and tax bases of assets and liabilities given the provisions of enacted tax laws. Deferred income tax provisions and benefits are based on changes to the assets or liabilities from year to year. In providing for deferred taxes, we consider tax regulations of the jurisdictions in which we operate, estimates of future taxable income, and available tax planning strategies. If tax regulations, operating results, or the ability to implement tax-planning strategies vary, adjustments to the carrying value of deferred tax assets and liabilities may be required. A valuation allowance is recorded when it is more likely than not that a deferred tax asset will not be realized. The recorded valuation allowance is based on significant estimates and judgments and if the facts and circumstances change, the valuation allowance could materially change.
In accounting for uncertainty in income taxes, we recognize the financial statement benefit of a tax position only after determining that the relevant tax authority would more likely than not sustain the position following an audit. For tax positions meeting the more likely than not threshold, the amount recognized in the financial statements is the largest benefit that has a greater than 50 percent likelihood of being realized upon ultimate settlement with the relevant tax authority. The Company recognizes interest and penalties accrued on any unrecognized tax benefits as a component of income tax expense.
As of September 30, 2015, the Company had U.S. federal and state net operating loss (“NOL”) carry-forwards of approximately $5,407,000 and $13,795,000, respectively. The U.S. federal NOL carry forward amounts expire in fiscal years 2023 through 2028 if not utilized. The state NOL carry forward amounts expire in fiscal years 2016 through 2022 if not utilized. In fiscal year 2009, the Company completed an Internal Revenue Code Section 382 analysis of the loss carry-forwards and determined that all of the Company’s loss carry-forwards were utilizable and not restricted under Section 382. The Company has not updated its Section 382 analysis subsequent to 2009 and does not believe there have been any events subsequent to 2009 that would impact the analysis.
As part of the process of preparing our financial statements, we are required to estimate our income tax liability in each of the jurisdictions in which we do business. This process involves estimating our actual current tax expense together with assessing temporary differences resulting from differing treatment of items for tax and accounting purposes. These differences result in deferred tax assets and liabilities. We must then assess the likelihood that these deferred tax assets will be recovered from future taxable income and, to the extent we believe that recovery is not more likely than not or unknown, we must establish a valuation allowance. If the valuation allowance is reduced, the Company would record an income tax benefit in the period in which that determination is made. If the valuation allowance is increased, the Company would record additional income tax expense.
| 17 |
As of September 30, 2014, the Company’s remaining valuation allowance of approximately $848,000 related to state net operating loss carry forwards. During the fourth quarter of 2015, the Company reversed a portion of its remaining valuation allowance primarily related to the expiration of state net operating losses in 2015. The remaining valuation allowance balance as of September 30, 2015 of $659,000 relates entirely to state net operating loss carry forwards we do not expect to utilize. The Company will continue to assess the assumptions used to determine the amount of our valuation allowance and may adjust the valuation allowance in future periods based on changes in assumptions of estimated future income and other factors.
The Company files income tax returns in the U.S. Federal jurisdiction, and various state jurisdictions. Based on its evaluation, the Company has concluded that it has no significant unrecognized tax benefits. With limited exceptions, the Company is no longer subject to U.S. federal and state income tax examinations for fiscal years ending prior to 2000. We are generally subject to U.S. federal and state tax examinations for all tax years since 2000 due to our net operating loss carryforwards and the utilization of the carryforwards in years still open under statute. In 2007, the Company changed its fiscal year end from March 31 to September 30.
Impairment of Long-Lived Assets and Goodwill The Company’s long-lived assets at September 30, 2015 consisted primarily of property, plant and equipment, patents and goodwill. The Company reviews the carrying amount of its property, plant and equipment and patents if events or changes in circumstances indicate that the carrying amount of the assets may not be recoverable. When this review indicates the carrying amount of an asset or asset group exceeds the sum of the future undiscounted cash flows expected to be generated by the assets, the Company recognizes an asset impairment charge against operations for the amount by which the carrying amount of the impaired asset exceeds its fair value.
Determining fair values of property, plant and equipment and patents using a discounted cash flow method involves significant judgment and requires the Company to make significant estimates and assumptions, including long-term projections of cash flows, market conditions and appropriate discount rates. Judgments are based on historical experience, current market trends, consultations with external valuation specialists and other information. If facts and circumstances change, the use of different estimates and assumptions could result in a materially different outcome. The Company generally develops these forecasts based on recent sales data for existing products, planned timing of new product launches, and estimated expansion of the FTTP market.
The Company operates as one reporting unit and reviews the carrying amount of goodwill annually in the fourth quarter of each fiscal year and more frequently if events or changes in circumstances indicate that the carrying amount of the assets may not be recoverable. The Company determines its fair value for goodwill impairment testing purposes by calculating its market capitalization and comparing that to the Company’s carrying value. The Company’s goodwill impairment test for the years ended September 30, 2015, 2014 and 2013 resulted in excess fair value over carrying value and therefore, no adjustments were made to goodwill. During the year ended September 30, 2015, there were no triggering events that indicated goodwill could be impaired.
A significant reduction in our market capitalization or in the carrying amount of net assets of a reporting unit could result in an impairment charge. If the carrying amount of a reporting unit exceeds its fair value, the Company would measure the possible goodwill impairment loss based on an allocation of the estimate of fair value of the reporting unit to all of the underlying assets and liabilities of the reporting unit, including any previously unrecognized intangible assets. The excess of the fair value of a reporting unit over the amounts assigned to its assets and liabilities is the implied fair value of goodwill. An impairment loss is recognized to the extent that a reporting unit's recorded goodwill exceeds the implied fair value of goodwill. An impairment loss would be based on significant estimates and judgments, and if the facts and circumstances change, a potential impairment could have a material impact on the Company’s financial statements.
| 18 |
No impairment of long-lived assets or goodwill has occurred during the years ended September 30, 2015, 2014 or 2013, respectively.
Valuation of Inventory The Company maintains a material amount of inventory to support its manufacturing operations and customer demand. This inventory is stated at the lower of cost or market. On a regular basis, the Company reviews its inventory and identifies that which is excess, slow moving and obsolete by considering factors such as inventory levels, expected product life and forecasted sales demand. Any identified excess, slow moving and obsolete inventory is written down to its market value through a charge to cost of sales. It is possible that additional inventory write-down charges may be required in the future if there is a significant decline in demand for the Company’s products and the Company does not adjust its manufacturing production accordingly.
Results of Operations
Year ended September 30, 2015 compared to year ended September 30, 2014
Net sales for fiscal year 2015 increased 4% to $60,324,000 from net sales of $58,045,000 in 2014. Sales growth was experienced from existing clients as well as from the development of new accounts within the telecommunications industry. The growth in sales includes gains from within Tier 3 Carriers, an emerging presence associated with Tier 2 Carriers who have a national footprint and cable providers, offset by lower sales to our CLEC customer group.
As a result of the above factors, sales in fiscal year 2015 to commercial data networks and broadband service providers were 91% of net sales, or $54,822,000, compared to $53,627,000, or 92%, of net sales in fiscal 2014. Among this group, the Company recorded $5,000,000 in international sales in fiscal year 2015 versus $5,358,000 in fiscal year 2014. Sales associated with build-to-print manufacturing for original equipment manufacturers outside of the telecommunications market in 2015 were 9% of net sales, or $5,502,000, compared to $4,418,000, or 8%, of net sales in fiscal year 2014. The Company allocates sales from external customers to geographic areas based on the location to which the product is transported. Accordingly, international sales represented 8% and 9% of net sales for the years ended September 30, 2015 and 2014, respectively.
The increase in net sales for the year ended September 30, 2015 of $2,279,000 compared to fiscal year 2014 is primarily attributable to an increase of $10,107,000 in net sales to our customer base of commercial data network providers, build-to-print and OEM manufacturers, and broadband service providers, outside of the CLEC group and international sales noted below, when compared to 2014. The improvement was due to increased deployments by the Company’s ILEC customers, as well as expanded sales channels. Offsetting this increase was a decrease of $7,470,000 related to a slowdown in ongoing builds of a CLEC customer. Net sales were also negatively affected by a decrease in international sales of $358,000 during the same period. The Company does not have the ability to forecast future sales as revenue from all customers is obtained from purchase orders submitted from time to time. Accordingly, the Company’s ability to predict orders in future periods or trends affecting orders in future periods is limited.
Cost of sales for fiscal year 2015 was $35,456,000, an increase of $2,009,000, or 6% from the $33,447,000 in fiscal year 2014. Gross margin was 41.2% in fiscal year 2015, as compared to 42.4% for fiscal year 2014. Gross profit increased 1%, or $269,000, from $24,599,000 for fiscal year 2014 to $24,868,000 for fiscal year 2015. The year-over-year increase in cost of sales is primarily a result of increased sales volume. Gross profit percentage decreased primarily as a result of costs associated with operations related to the addition of our Mexico manufacturing facility in late fiscal year 2014 in the amount of $249,000 along with product mix changes of $601,000.
| 19 |
Selling, general and administrative expense for fiscal year 2015 was $17,817,000, up 11% compared to $16,081,000 for fiscal year 2014. This increase is primarily composed of higher compensation expenses in the amount of $997,000 mainly due to additional personnel and wage increases and one-time costs of $137,000 associated with our move to expanded U.S. operations which was completed in the second quarter. Also, stock compensation expense increased $280,000 when compared to the same period of 2014 due to a higher amount of equity awards outstanding. Additionally, depreciation increased $252,000 compared to the same period of 2014 primarily due an increase in leasehold improvements associated with our new facility.
Income from operations for fiscal year 2015 was $7,051,000 compared to $8,518,000 for fiscal year 2014. This decrease is attributable to increased selling, general and administrative expense.
Interest income in fiscal year 2015 was $106,000 compared to $96,000 for fiscal year 2014. The Company invests its excess cash primarily in FDIC-backed bank certificates of deposit and money market accounts.
Income tax expense for fiscal year 2015 was $2,475,000 compared to $3,181,000 for fiscal year 2014. Due to net operating loss utilization, income tax expense primarily had a non-cash effect on the operating cash flow for the years ended September 30, 2015 and 2014. The decrease in tax expense of $706,000 from the year ended September 30, 2014 is primarily due to decreased deferred tax expense resulting from lower profitability in fiscal year 2015. The decrease in the income tax expense rate to 34.6% for fiscal year 2015 from 36.9% for fiscal year 2014 is primarily the result of the Company reversing a portion of its remaining valuation allowance primarily related to the expiration of state net operating losses in 2015 during the fourth quarter of fiscal year 2015. Our provisions for income taxes include current federal alternative minimum tax expense, state income tax expense and deferred tax expense.
Net income for fiscal year 2015 was $4,682,000 or $0.35 per basic share and $0.34 per diluted share, compared to $5,433,000 or $0.42 per basic share and $0.40 per diluted share for the year 2014.
Year ended September 30, 2014 compared to year ended September 30, 2013
Net sales for fiscal year 2014 increased 9% to $58,045,000 from net sales of $53,353,000 in 2013. Sales growth was experienced from existing clients as well as from the development of new accounts within the telecommunications industry. The growth in sales includes gains from within Tier 3 Carriers, an emerging presence associated with Tier 2 Carriers who have a national footprint, cable providers as well as non-traditional providers who are entering the U.S. market. The Company also recorded a growing percentage of its sales from accounts outside of the U.S., principally Canada and the Caribbean regions of Central America.
As a result of the above factors, sales in fiscal year 2014 to commercial data networks and broadband service providers were 92% of net sales, or $53,627,000, compared to $48,048,000, or 90%, of net sales in fiscal 2013. Among this group, the Company recorded $5,358,000 in international sales in fiscal year 2014 versus $2,995,000 in fiscal year 2013. Sales associated with build-to-print manufacturing for original equipment manufacturers outside of the telecommunications market in 2014 were 8% of net sales, or $4,418,000, compared to $5,305,000, or 10%, of net sales in fiscal year 2013. The Company allocates sales from external customers to geographic areas based on the location to which the product is transported. Accordingly, international sales represented 9% and 6% of net sales for the years ended September 30, 2014 and 2013, respectively.
| 20 |
The increase in net sales for the year ended September 30, 2014 of $4,692,000 compared to fiscal year 2013 is primarily attributable to an increase of $2,363,000 in international sales. Additionally, the Company’s net sales to our customer base of commercial data network providers, build-to-print and OEM manufacturers, and broadband service providers, outside of internationally noted above, increased $2,329,000 for the year ended September 30, 2014 mainly due to higher demand in fiscal year 2014 when compared to fiscal year 2013. The Company does not have the ability to forecast future sales as revenue from all customers is obtained from purchase orders submitted from time to time. Accordingly, the Company’s ability to predict orders in future periods or trends affecting orders in future periods is limited.
Cost of sales for fiscal year 2014 was $33,447,000, an increase of $2,083,000, or 7% from the $31,364,000 in fiscal year 2013. Gross margin was 42.4% in fiscal year 2014, as compared to 41.2% for fiscal year 2013. Gross profit increased 12%, or $2,609,000, from $21,990,000 for fiscal year 2013 to $24,599,000 for fiscal year 2014. The year-over-year increase in cost of sales and gross profit is a result of increased net sales. The increase in gross profit percentage is the result of a higher percentage of sales associated with optical component technologies, which generally have higher margins.
Selling, general and administrative expense for fiscal year 2014 was $16,081,000, up 11% compared to $14,545,000 for fiscal year 2013. This increase is primarily composed of $1,515,000 due to additional personnel.
Income from operations for fiscal year 2014 was $8,518,000 compared to $7,445,000 for fiscal year 2013. This increase is attributable to increased net sales and higher gross margin.
Interest income in fiscal year 2014 was $96,000 compared to $92,000 for fiscal year 2013. The Company invests its excess cash primarily in FDIC-backed bank certificates of deposit and money market accounts.
Income tax expense for fiscal year 2014 was $3,181,000 compared to $2,803,000 for fiscal year 2013. Due to net operating loss utilization, income tax expense primarily had a non-cash effect on the operating cash flow for the years ended September 30, 2014 and 2013. The increase in tax expense of $378,000 from the year ended September 30, 2013 is primarily due to deferred tax expense resulting from higher profitability in fiscal year 2014. Our provisions for income taxes include current federal alternative minimum tax expense, state income tax expense and deferred tax expense.
Net income for fiscal year 2014 was $5,433,000 or $0.42 per basic share and $0.40 per diluted share, compared to $4,734,000 or $0.38 per basic share and $0.36 per diluted share for the year 2013.
Liquidity and Capital Resources
At September 30, 2015, the Company had combined balances of short-term cash and investments and long-term investments of $34,286,000 as compared to $33,125,000 at September 30, 2014. As of September 30, 2015, our principal source of liquidity was our cash and cash equivalents and short-term investments. Those sources total $25,996,000 at September 30, 2015, compared to $24,823,000, at September 30, 2014. Investments considered long-term are $8,290,000 at September 30, 2015, compared to $8,302,000 at September 30, 2014. Our excess cash is invested mainly in certificates of deposit backed by the FDIC and money market accounts. Substantially all of our funds are insured by the FDIC. We believe the combined balances of short-term cash and investments along with long-term investments provide a more accurate indication of our available liquidity. We had no long-term debt obligations at September 30, 2015 or 2014, respectively.
We believe our existing cash equivalents and short-term investments, along with cash flow from operations, will be sufficient to meet our working capital and investment requirements for beyond the next 12 months. The Company intends on utilizing its available cash and assets primarily for its continued organic growth and potential future strategic transactions, as well as execution of the $8,000,000 share repurchase program adopted by the Board of Directors on November 13, 2014.
| 21 |
Operating Activities
Net cash generated from operations for the fiscal year ended September 30, 2015 totaled $6,848,000. Cash provided by operations included net income of $4,682,000 for the fiscal year ended September 30, 2015, which included non-cash expenses for depreciation and amortization of $1,216,000 and stock-based compensation of $1,075,000, along with a non-cash benefit from deferred taxes of $2,342,000. The Company has historically been utilizing its net operating losses (“NOLs”) for taxes due and has had cash payments related to taxes of $51,000, $361,000 and $154,000 in the fiscal periods 2015, 2014 and 2013, respectively. When the NOLs are fully consumed, the Company will no longer have this non-cash tax benefit which will result in the Company having to use cash for its tax expense. Changes between fiscal year 2015 and fiscal year 2014 in working capital items using cash included increases in inventory and accounts receivable of $1,793,000 and $983,000, respectively. The increase in inventory represents an adjustment for seasonal demand along with changes in stocking levels for new product development. The increase in accounts receivable is primarily attributable to increased sales in the quarter ended September 30, 2015. Accounts receivable balances can be influenced by the timing of shipments for customer projects and payment terms. Days sales outstanding, which measures how quickly receivables are collected, increased three days to 35 days from September 30, 2014 to September 30, 2015. Changes in working capital items providing cash between fiscal year 2015 and fiscal year 2014 included an increase in accounts payable and accrued expenses of $164,000 and a decrease in other current assets of $121,000.
Net cash generated from operations for the fiscal year ended September 30, 2014 totaled $11,529,000. Cash provided by operations included net income of $5,433,000 for the fiscal year ended September 30, 2014, which included non-cash expenses for depreciation and amortization of $700,000 and stock-based compensation of $795,000, along with a non-cash benefit from deferred taxes of $3,020,000. Changes between fiscal year 2014 and fiscal year 2013 in working capital items providing cash included decreases in accounts receivable and inventory of $2,810,000 and $236,000, respectively. Accounts receivable balances can be influenced by the timing of shipments for customer projects and payment terms. The decrease in accounts receivable was primarily the result of significant payments received in the first quarter from one customer with a large balance at September 30, 2013, and lower sales in the fourth quarter of fiscal 2014 compared to fiscal 2013, resulting in a substantially lower balance at September 30, 2014. The decrease in inventory reflects the fulfillment of orders that were in the Company’s backlog as of September 30, 2013 and also represents an adjustment for seasonal demand along with changes in stocking levels for new product development. Changes in working capital items using cash between fiscal year 2014 and fiscal year 2013 included a decrease in accounts payable and accrued expenses of $1,234,000 and an increase in other current assets of $243,000. Changes in accounts payable and accrued expenses primarily reflect a decrease related to fiscal year 2013 accrued bonus compensation accruals of $2,691,000 which were paid during the first quarter of fiscal year 2014.
Net cash generated from operations for the fiscal year ended September 30, 2013 totaled $4,339,000. Cash provided by operations included net income of $4,734,000 for the fiscal year ended September 30, 2013, which included non-cash expenses for depreciation and amortization of $476,000 and stock-based compensation of $754,000, along with a non-cash benefit from deferred taxes of $2,564,000. Changes between fiscal year 2013 and fiscal year 2012 in working capital items using cash included an increase in accounts receivable of $4,815,000, reflecting increased sales levels in the fourth quarter of 2013, and an increase in inventory of $2,655,000. Accounts receivable balances can be influenced by the timing of shipments for customer projects and payment terms. The increase in inventory reflects higher stocking levels for existing products due to higher demand, and for new product offerings including Clearview Blue and FieldShield. Changes in working capital items providing cash between fiscal year 2013 and fiscal year 2012 included an increase in accounts payable and accrued expenses of $3,281,000. Changes in accounts payable and accrued expenses reflect an increase to employee compensation accruals of $1,888,000 associated with higher sales.
| 22 |
Investing Activities
For the fiscal year ended September 30, 2015, we used $4,543,000 in cash for the purchase of capital equipment and patents. Included in this amount were purchases of $3,027,000 in leasehold improvements and office equipment for the build out of our new Minnesota facility which was completed in the fiscal 2015 second quarter and purchases of manufacturing and warehouse equipment of $1,079,000. During fiscal year 2015, we purchased $10,374,000 of FDIC-backed certificates of deposit and sold $9,093,000 of FDIC-backed certificates of deposit. The result is cash used in investing activities of $5,744,000 in fiscal year 2015 as compared to $3,586,000 in fiscal year 2014. In the future, the Company intends to invest in the necessary computer hardware and software required to optimize its business, along with appropriate manufacturing equipment to continue to maintain a competitive position in manufacturing capability.
For the fiscal year ended September 30, 2014, we used $1,455,000 in cash for the purchase of capital equipment and prosecution of patents. Included in this amount were purchases for manufacturing equipment in the amount of $851,000. During the same period, we purchased $8,899,000 of FDIC-backed certificates of deposit and sold $6,727,000 of FDIC-backed certificates of deposit. The result is cash used in investing activities of $3,586,000 in fiscal year 2014 as compared to $114,000 in fiscal year 2013.
For the fiscal year ended September 30, 2013, we used $1,037,000 in cash for the purchase of capital equipment and patents. Included in this amount were purchases for manufacturing equipment in the amount of $947,000. During the same period we purchased $8,683,000 of FDIC-backed certificates of deposit and sold $9,600,000 of FDIC-backed certificates of deposit. The result is cash used in investing activities of $114,000 in fiscal year 2013 as compared to $9,714,000 in fiscal year 2012.
Financing Activities
For the fiscal year ended September 30, 2015, the Company used $849,000 for the repurchase of common stock. Also, the Company received $211,000 and $43,000 during the fiscal year ended September 30, 2015 from employees’ purchase of stock through our Employee Stock Purchase Plan (“ESPP”) and the exercise of stock options, respectively. The Company used $639,000 to pay for taxes as a result of employees’ exercises of stock options and vesting of restricted shares using share withholding. As a result, the net cash used by financing activities during fiscal year 2015 was $1,224,000.
For the fiscal year ended September 30, 2014, the Company received $186,000 and $646,000 from employees’ purchase of stock through our ESPP and the exercise of stock options, respectively. The Company used $400,000 to pay for taxes as a result of employees’ exercises of stock options and vesting of restricted shares using share withholding. As a result, the net cash provided by financing activities during fiscal year 2014 was $441,000.
For the fiscal year ended September 30, 2013, the Company received $64,000 and $136,000 from employees’ purchase of stock through our ESPP and the exercise of stock options, respectively. The Company used $298,000 to pay for taxes as a result of employees’ exercises of stock options and vesting of restricted shares using share withholding. As a result, the net cash used in financing activities during fiscal year 2013 was $95,000.
Contractual Obligations as of September 30, 2015
| Payments due by period | ||||||||||||||||||||
| Total | Less than 1 year | 1-3 years | 3-5 years | More than 5 years | ||||||||||||||||
| Operating lease obligations | $ | 3,798,079 | $ | 433,189 | $ | 737,709 | $ | 775,064 | $ | 1,852,117 | ||||||||||
| Total | $ | 3,798,079 | $ | 433,189 | $ | 737,709 | $ | 775,064 | $ | 1,852,117 | ||||||||||
| 23 |
Operating Leases
We have entered into various non-cancelable operating lease agreements, including the lease in Brooklyn Park, Minnesota that was entered into on September 9, 2014 with a lease term that commenced on January 1, 2015. Certain of these leases have escalating rent payment provisions. We recognize rent expense under such leases on a straight-line basis over the term of the lease.
Quarterly Financial Data (Unaudited)
Quarterly data for the years ended September 30, 2015 and 2014 was as follows:
| Quarter Ended | ||||||||||||||||
| Statement of Earnings Data | December 31, 2014 | March 31, 2015 | June 30, 2015 | September 30, 2015 | ||||||||||||
| Net sales | $ | 13,986,620 | $ | 12,370,784 | $ | 18,195,911 | $ | 15,770,602 | ||||||||
| Gross profit | 5,742,514 | 4,753,437 | 7,796,740 | 6,575,262 | ||||||||||||
| Income from operations | 1,616,517 | 464,133 | 2,950,976 | 2,019,729 | ||||||||||||
| Net income | 1,069,373 | 288,661 | 1,952,900 | 1,371,074 | ||||||||||||
| Net income per share Basic | $ | 0.08 | $ | 0.02 | $ | 0.15 | $ | 0.10 | ||||||||
| Net income per share Diluted | $ | 0.08 | $ | 0.02 | $ | 0.14 | $ | 0.10 | ||||||||
| Quarter Ended | ||||||||||||||||
| Statement of Earnings Data | December 31, 2013 | March 31, 2014 | June 30, 2014 | September 30, 2014 | ||||||||||||
| Net sales | $ | 16,147,622 | $ | 13,213,855 | $ | 14,362,934 | $ | 14,320,881 | ||||||||
| Gross profit | 6,937,645 | 5,720,563 | 6,043,453 | 5,897,105 | ||||||||||||
| Income from operations | 3,072,626 | 1,915,552 | 1,858,296 | 1,671,652 | ||||||||||||
| Net income | 1,982,326 | 1,226,305 | 1,174,840 | 1,049,380 | ||||||||||||
| Net income per share Basic | $ | 0.16 | $ | 0.09 | $ | 0.09 | $ | 0.08 | ||||||||
| Net income per share Diluted | $ | 0.15 | $ | 0.09 | $ | 0.08 | $ | 0.08 | ||||||||
Recent Accounting Pronouncements:
In May 2014, the Financial Accounting Standards Board (“FASB”) issued guidance creating Accounting Standards Codification (“ASC”) Section 606, “Revenue from Contracts with Customers”. The new section will replace Section 605, “Revenue Recognition” and creates modifications to various other revenue accounting standards for specialized transactions and industries. The section is intended to conform revenue accounting principles with a concurrently issued International Financial Reporting Standards with previously differing treatment between United States practice and those of much of the rest of the world, as well as, to enhance disclosures related to disaggregated revenue information. The updated guidance is effective for annual reporting periods beginning after December 15, 2017, and interim periods within that reporting period. Early application is permitted only as of annual reporting periods beginning after December 15, 2016, including interim periods within that reporting period. The Company will further study the implications of this statement in order to evaluate the expected impact on its financial statements.
In July 2015, the FASB issued Accounting Standards Update (“ASU”) 2015-11, Inventory (Topic 330) Related to Simplifying the Measurement of Inventory which applies to all inventory except inventory that is measured using last-in, first-out (“LIFO”) or the retail inventory method. Inventory measured using first-in, first-out (“FIFO”) or average cost is covered by the new amendments. Inventory within the scope of the new guidance should be measured at the lower of cost and net realizable value. Net realizable value is the estimated selling prices in the ordinary course of business, less reasonably predictable costs of completion, disposal, and transportation. Subsequent measurement is unchanged for inventory measured using LIFO or the retail inventory method. The amendments will take effect for public business entities for fiscal years beginning after December 15, 2016, including interim periods within those fiscal years. The new guidance should be applied prospectively, and earlier application is permitted as of the beginning of an interim or annual reporting period. The Company is evaluating the impact of the standard on its financial statements.
| 24 |
ITEM 7A. QUANTITATIVE AND QUALITATIVE DISCLOSURES ABOUT MARKET RISK
The Company is subject to changes in market interest rates on cash, cash equivalents, and short-term investments. These market risks have not changed significantly since September 30, 2014. Increases or decreases in interest rates will have an effect on these balances. At September 30, 2015, and 2014, the Company had cash and cash equivalents and short-term investments totaling $25,996,000 and $24,823,000, respectively. Most of these balances were invested in interest-bearing money market accounts or CD’s maturing within 12 months. Due to the nature of these money market accounts and CD’s, we believe that we do not have any material exposure to changes in the fair value of our cash equivalents and short-term investments as a result of changes in interest rates.
The Company uses the U.S. dollar as its functional currency. As such, fluctuations in foreign currency exchange rates have historically not been material to the Company. Accordingly, the Company believes it does not have any material exposure to fluctuations in foreign currency.
| 25 |
ITEM 8. FINANCIAL STATEMENTS AND SUPPLEMENTARY DATA
Clearfield, Inc.
INDEX TO FINANCIAL STATEMENTS
The supplementary financial information required by this Item 8
is included in Item 7 under the caption “Quarterly Financial Data (Unaudited).”
| 26 |
Report of Independent Registered Public Accounting Firm
To the Shareholders, Audit Committee and Board of Directors
Clearfield, Inc.
Minneapolis, MN
We have audited the accompanying balance sheets of Clearfield, Inc. as of September 30, 2015 and 2014, and the related statements of earnings, shareholders' equity and cash flows for the years then ended. We also have audited Clearfield, Inc.'s internal control over financial reporting as of September 30, 2015, based on criteria established in Internal Control - Integrated Framework issued by the Committee of Sponsoring Organizations of the Treadway Commission (COSO) (2013 framework). These financial statements are the responsibility of the company's management. Our responsibility is to express an opinion on these financial statements and an opinion on the company's internal control over financial reporting based on our audits.
We conducted our audits in accordance with the standards of the Public Company Accounting Oversight Board (United States). Those standards require that we plan and perform the audit to obtain reasonable assurance about whether the financial statements are free of material misstatement and whether effective internal control over financial reporting was maintained in all material respects. Our audits of the financial statements include examining, on a test basis, evidence supporting the amounts and disclosures in the financial statements, assessing the accounting principles used and significant estimates made by management, and evaluating the overall financial statement presentation. Our audit of internal control over financial reporting included obtaining an understanding of internal control over financial reporting, assessing the risk that a material weakness exists, and testing and evaluating the design and operating effectiveness of internal control based on the assessed risk. Our audits also included performing such other procedures as we considered necessary in the circumstances. We believe that our audits provide a reasonable basis for our opinions.
A company's internal control over financial reporting is a process designed to provide reasonable assurance regarding the reliability of financial reporting and the preparation of financial statements for external purposes in accordance with generally accepted accounting principles. A company's internal control over financial reporting includes those policies and procedures that (1) pertain to the maintenance of records that, in reasonable detail, accurately and fairly reflect the transactions and dispositions of the assets of the company; (2) provide reasonable assurance that transactions are recorded as necessary to permit preparation of financial statements in accordance with generally accepted accounting principles, and that receipts and expenditures of the company are being made only in accordance with authorizations of management and directors of the company; and (3) provide reasonable assurance regarding prevention or timely detection of unauthorized acquisition, use, or disposition of the company's assets that could have a material effect on the financial statements.
Because of its inherent limitations, internal control over financial reporting may not prevent or detect misstatements. Also, projections of any evaluation of effectiveness to future periods are subject to the risk that controls may become inadequate because of changes in conditions, or that the degree of compliance with the policies or procedures may deteriorate.
In our opinion, the financial statements referred to above present fairly, in all material respects, the financial position of Clearfield, Inc. as of September 30, 2015 and 2014 and the results of its operations and cash flows for the years then ended, in conformity with accounting principles generally accepted in the United States of America. Also in our opinion, Clearfield, Inc. maintained, in all material respects, effective internal control over financial reporting as of September 30, 2015, based on criteria established in Internal Control - Integrated Framework issued by the Committee of Sponsoring Organizations of the Treadway Commission (COSO) (2013 framework).
/s/ BAKER TILLY VIRCHOW KRAUSE, LLP
Minneapolis, Minnesota
November 25, 2015
| 27 |
Report of Independent Registered Public Accounting Firm
Board of Directors and Shareholders
Clearfield, Inc.
We have audited the accompanying statements of earnings, shareholders’ equity, and cash flows of Clearfield, Inc. (a Minnesota corporation) (the “Company”) for the year ended September 30, 2013. These financial statements are the responsibility of the Company’s management. Our responsibility is to express an opinion on these financial statements based on our audit.
We conducted our audit in accordance with the standards of the Public Company Accounting Oversight Board (United States). Those standards require that we plan and perform the audit to obtain reasonable assurance about whether the financial statements are free of material misstatement. We were not engaged to perform an audit of the Company’s internal control over financial reporting. Our audit included consideration of internal control over financial reporting as a basis for designing audit procedures that are appropriate in the circumstances, but not for the purpose of expressing an opinion on the effectiveness of the Company’s internal control over financial reporting. Accordingly, we express no such opinion. An audit also includes examining, on a test basis, evidence supporting the amounts and disclosures in the financial statements, assessing the accounting principles used and significant estimates made by management, as well as evaluating the overall financial statement presentation. We believe that our audit provides a reasonable basis for our opinion.
In our opinion, the financial statements referred to above present fairly, in all material respects, the results of operations and cash flows of Clearfield, Inc. for the year ended September 30, 2013 in conformity with accounting principles generally accepted in the United States of America.
/s/ GRANT THORNTON LLP
Minneapolis, Minnesota
November 21, 2013
| 28 |
BALANCE SHEETS
| September 30, 2015 | September 30, 2014 | |||||||
| Assets | ||||||||
| Current Assets | ||||||||
| Cash and cash equivalents | $ | 18,071,210 | $ | 18,191,493 | ||||
| Short-term investments | 7,925,000 | 6,632,000 | ||||||
| Accounts receivable, net | 6,010,900 | 5,027,856 | ||||||
| Inventories | 7,182,854 | 5,390,342 | ||||||
| Deferred taxes | 1,146,899 | 2,249,435 | ||||||
| Other current assets | 416,766 | 543,257 | ||||||
| Total current assets | 40,753,629 | 38,034,383 | ||||||
| Property, plant and equipment, net | 5,689,673 | 2,462,250 | ||||||
| Other Assets | ||||||||
| Long-term investments | 8,290,000 | 8,302,000 | ||||||
| Goodwill | 2,570,511 | 2,570,511 | ||||||
| Deferred taxes | - | 156,622 | ||||||
| Other | 323,804 | 322,132 | ||||||
| Total other assets | 11,184,315 | 11,351,265 | ||||||
| Total Assets | $ | 57,627,617 | $ | 51,847,898 | ||||
| Liabilities and Shareholders’ Equity | ||||||||
| Current Liabilities | ||||||||
| Accounts payable | $ | 2,357,791 | $ | 2,104,526 | ||||
| Accrued compensation | 2,598,661 | 2,749,080 | ||||||
| Accrued expenses | 80,803 | 247,658 | ||||||
| Total current liabilities | 5,037,255 | 5,101,264 | ||||||
| Other Liabilities | ||||||||
| Deferred taxes | 1,082,887 | - | ||||||
| Deferred rent | 228,345 | - | ||||||
| Total other liabilities | 1,311,232 | - | ||||||
| Total Liabilities | 6,348,487 | 5,101,264 | ||||||
| Commitment and Contingencies | ||||||||
| Shareholders’ Equity | ||||||||
| Preferred stock, $.01 par value; 500 shares; no shares issued or outstanding | - | - | ||||||
| Common stock, $ .01 par value; 50,000,000 shares authorized; 13,705,658 and 13,742,964 shares issued and outstanding at September 30, 2015 and 2014, respectively | 137,057 | 137,430 | ||||||
| Additional paid-in capital | 55,887,850 | 56,036,989 | ||||||
| Accumulated deficit | (4,745,777 | ) | (9,427,785 | ) | ||||
| Total shareholders’ equity | 51,279,130 | 46,746,634 | ||||||
| Total Liabilities and Shareholders’ Equity | $ | 57,627,617 | $ | 51,847,898 | ||||
The accompanying notes are an integral part of these financial statements.
| 29 |
STATEMENTS OF EARNINGS
| Year Ended September 30, 2015 | Year Ended September 30, 2014 | Year Ended September 30, 2013 | ||||||||||
| Net sales | $ | 60,323,917 | $ | 58,045,292 | $ | 53,353,080 | ||||||
| Cost of sales | 35,455,964 | 33,446,526 | 31,363,502 | |||||||||
| Gross profit | 24,867,953 | 24,598,766 | 21,989,578 | |||||||||
| Operating expenses | ||||||||||||
| Selling, general and administrative | 17,816,598 | 16,080,640 | 14,544,843 | |||||||||
| Income from operations | 7,051,355 | 8,518,126 | 7,444,735 | |||||||||
| Interest income | 105,891 | 95,703 | 92,281 | |||||||||
| Income before income taxes | 7,157,246 | 8,613,829 | 7,537,016 | |||||||||
| Income tax expense | 2,475,238 | 3,180,978 | 2,803,172 | |||||||||
| Net income | $ | 4,682,008 | $ | 5,432,851 | $ | 4,733,844 | ||||||
| Net income per share Basic | $ | 0.35 | $ | 0.42 | $ | 0.38 | ||||||
| Net income per share Diluted | $ | 0.34 | $ | 0.40 | $ | 0.36 | ||||||
| Shares used in calculation of net income per share: | ||||||||||||
| Basic | 13,216,010 | 12,916,273 | 12,527,153 | |||||||||
| Diluted | 13,587,532 | 13,601,594 | 13,078,939 | |||||||||
The accompanying notes are an integral part of these financial statements.
| 30 |
STATEMENTS OF SHAREHOLDERS’ EQUITY
| Common Stock | ||||||||||||||||||||
| Shares | Amount | Additional paid-in capital | Accumulated deficit | Total shareholders’ equity | ||||||||||||||||
| Balance at September 30, 2012 | 12,830,100 | $ | 128,301 | $ | 54,152,080 | $ | (19,594,480 | ) | $ | 34,685,901 | ||||||||||
| Stock-based compensation expense | - | - | 753,727 | - | 753,727 | |||||||||||||||
| Restricted stock issuance, net | 4,090 | 41 | 25 | - | 66 | |||||||||||||||
| Employee stock purchase plan | 35,597 | 356 | 135,625 | - | 135,981 | |||||||||||||||
| Exercise of stock options, net of shares exchanged for payment | 139,455 | 1,394 | 62,606 | - | 64,000 | |||||||||||||||
| Tax withholding related to vesting of restricted stock grants and exercise of stock options | (34,979 | ) | (349 | ) | (297,639 | ) | - | (297,988 | ) | |||||||||||
| Excess tax benefit of stock options exercised | - | - | 2,505 | - | 2,505 | |||||||||||||||
| Net income | - | - | - | 4,733,844 | 4,733,844 | |||||||||||||||
| Balance at September 30, 2013 | 12,974,263 | 129,743 | 54,808,929 | (14,860,636 | ) | 40,078,036 | ||||||||||||||
| Stock-based compensation expense | - | - | 794,865 | - | 794,865 | |||||||||||||||
| Restricted stock issuance, net | 305,615 | 3,056 | (3,056 | ) | - | - | ||||||||||||||
| Employee stock purchase plan | 17,589 | 176 | 185,408 | - | 185,584 | |||||||||||||||
| Exercise of stock options, net of shares exchanged for payment | 471,603 | 4,716 | 641,737 | - | 646,453 | |||||||||||||||
| Tax withholding related to vesting of restricted stock grants and exercise of stock options | (26,106 | ) | (261 | ) | (399,368 | ) | - | (399,629 | ) | |||||||||||
| Excess tax benefit of stock options exercised | - | - | 8,474 | - | 8,474 | |||||||||||||||
| Net income | - | - | - | 5,432,851 | 5,432,851 | |||||||||||||||
| Balance at September 30, 2014 | 13,742,964 | 137,430 | 56,036,989 | (9,427,785 | ) | 46,746,634 | ||||||||||||||
| Stock-based compensation expense | - | - | 1,074,727 | - | 1,074,727 | |||||||||||||||
| Repurchase of common stock | (72,089 | ) | (721 | ) | (848,436 | ) | - | (849,157 | ) | |||||||||||
| Restricted stock forfeiture, net | (7,900 | ) | (79 | ) | 79 | - | - | |||||||||||||
| Employee stock purchase plan | 20,216 | 202 | 211,257 | - | 211,459 | |||||||||||||||
| Exercise of stock options, net of shares exchanged for payment | 60,011 | 600 | 42,506 | - | 43,106 | |||||||||||||||
| Tax withholding related to vesting of restricted stock grants and exercise of stock options | (37,544 | ) | (375 | ) | (638,932 | ) | - | (639,307 | ) | |||||||||||
| Excess tax benefit of stock options exercised | - | - | 9,660 | - | 9,660 | |||||||||||||||
| Net income | - | - | - | 4,682,008 | 4,682,008 | |||||||||||||||
| Balance at September 30, 2015 | 13,705,658 | $ | 137,057 | $ | 55,887,850 | $ | (4,745,777 | ) | $ | 51,279,130 | ||||||||||
The accompanying notes are an integral part of these financial statements.
| 31 |
STATEMENTS OF CASH FLOWS
| Year Ended September 30, 2015 | Year Ended September 30, 2014 | Year Ended September 30, 2013 | ||||||||||
| Cash flows from operating activities: | ||||||||||||
| Net income | $ | 4,682,008 | $ | 5,432,851 | $ | 4,733,844 | ||||||
| Adjustments to reconcile net income to cash provided by operating activities: | ||||||||||||
| Depreciation and amortization | 1,216,083 | 699,869 | 476,400 | |||||||||
| Deferred income taxes | 2,342,045 | 3,019,626 | 2,564,045 | |||||||||
| Loss on disposal of assets | 23,196 | 12,809 | 15,388 | |||||||||
| Stock-based compensation expense | 1,074,727 | 794,865 | 753,727 | |||||||||
| Changes in operating assets and liabilities: | ||||||||||||
| Accounts receivable, net | (983,044 | ) | 2,809,687 | (4,814,907 | ) | |||||||
| Inventories | (1,792,512 | ) | 236,422 | (2,655,150 | ) | |||||||
| Other current assets | 121,381 | (243,339 | ) | (15,157 | ) | |||||||
| Accounts payable and accrued expenses | 164,336 | (1,234,039 | ) | 3,280,866 | ||||||||
| Net cash provided by operating activities | 6,848,220 | 11,528,751 | 4,339,056 | |||||||||
| Cash flows from investing activities: | ||||||||||||
| Purchases of property and equipment | (4,518,782 | ) | (1,418,461 | ) | (1,018,453 | ) | ||||||
| Purchase of investments | (10,374,000 | ) | (8,899,000 | ) | (8,683,000 | ) | ||||||
| Proceeds from sale of property and equipment | 79,936 | 40,908 | 6,500 | |||||||||
| Patent additions | (24,418 | ) | (36,544 | ) | (18,853 | ) | ||||||
| Sale of investments | 9,093,000 | 6,727,000 | 9,600,000 | |||||||||
| Net cash used in investing activities | (5,744,264 | ) | (3,586,097 | ) | (113,806 | ) | ||||||
| Cash flows from financing activities: | ||||||||||||
| Repurchase of common stock | (849,157 | ) | - | - | ||||||||
| Proceeds from issuance of common stock under employee stock purchase plan | 211,459 | 185,584 | 135,981 | |||||||||
| Proceeds from issuance of common stock | 43,106 | 646,453 | 64,066 | |||||||||
| Excess tax benefit from exercise of stock options | 9,660 | 8,474 | 2,505 | |||||||||
| Tax withholding related to vesting of restricted stock grants and exercise of stock options | (639,307 | ) | (399,629 | ) | (297,988 | ) | ||||||
| Net cash (used in) provided by financing activities | (1,224,239 | ) | 440,882 | (95,436 | ) | |||||||
| (Decrease) increase in cash and cash equivalents | (120,283 | ) | 8,383,536 | 4,129,814 | ||||||||
| Cash and cash equivalents at beginning of year | 18,191,493 | 9,807,957 | 5,678,143 | |||||||||
| Cash and cash equivalents at end of year | $ | 18,071,210 | $ | 18,191,493 | $ | 9,807,957 | ||||||
| Supplemental cash flow information | ||||||||||||
| Cash paid during the year for income taxes | $ | 50,850 | $ | 361,284 | $ | 153,644 | ||||||
| Non-cash financing activities | ||||||||||||
| Cashless exercise of stock options | $ | 207,738 | $ | 297,883 | $ | 242,848 | ||||||
The accompanying notes are an integral part of these financial statements.
| 32 |
NOTE A – SUMMARY OF SIGNIFICANT ACCOUNTING POLICIES
Description of Business: Clearfield, Inc., (the “Company”) is a manufacturer of a broad range of standard and custom passive connectivity products to customers throughout the United States. These products include fiber distribution systems, optical components, Outside Plant (“OSP”) cabinets, and fiber and copper cable assemblies that serve the communication service provider, including Fiber-to-the-Premises (“FTTP”), large enterprise, and original equipment manufacturer (“OEM”) markets.
Revenue Recognition: Revenue is recognized when persuasive evidence of an arrangement exists, the product has been delivered, the fee is fixed, acceptance by the customer is reasonably certain and collection is reasonably assured. This generally occurs upon shipment of product to the customer. Sales of the Company’s products are subject to limited warranty obligations that are included in the Company’s terms and conditions. Also, the Company offers limited discounts and rebates to customers which are recorded in net sales on an estimated basis as the sales are recognized. The Company records freight revenues billed to customers as sales and the related shipping and handling cost in cost of sales. Taxes collected from customers and remitted to governmental authorities are presented on a net basis.
Cash and Cash Equivalents: The Company considers all highly liquid investments with original maturities of three months or less to be cash equivalents. Cash equivalents at September 30, 2015 and 2014 consist entirely of short-term money market accounts.
The Company maintains cash balances at several financial institutions, and at times, such balances exceed insured limits. The Company has not experienced any losses in such accounts and believes it is not exposed to any significant credit risk on cash and cash equivalents.
Investments: The Company currently invests its excess cash in bank certificates of deposit (“CD’s”) that are fully insured by the Federal Deposit Insurance Corporation (“FDIC)” with a term of not more than three years. CD’s with original maturities of more than three months are reported as held-to-maturity investments and are recorded at amortized cost, which approximates fair value due to the negligible risk of changes in value due to interest rates. The maturity dates of our CD’s are as follows:
| September 30, 2015 | September 30, 2014 | |||||||
| Less than one year | $ | 7,925,000 | $ | 6,632,000 | ||||
| 1-3 years | 8,290,000 | 8,302,000 | ||||||
| Total | $ | 16,215,000 | $ | 14,934,000 | ||||
Accounts Receivable: Credit is extended based on the evaluation of a customer’s financial condition and collateral is generally not required. Accounts that are outstanding longer than the contractual payment terms are considered past due. The Company does not charge interest on past due receivables. The Company determines its allowance by considering a number of factors, including the length of time trade receivables are past due, the Company’s previous loss history, the customer’s current ability to pay its obligation to the Company, and the condition of the general economy and the industry as whole. The Company writes off accounts receivable when they become uncollectible; payments subsequently received on such receivables are credited to the allowance for doubtful accounts.
| 33 |
NOTE A – SUMMARY OF SIGNIFICANT ACCOUNTING POLICIES - Continued
The allowance for doubtful accounts activity for the years ended September 30, 2015, 2014 and 2013 is as follows:
| Year Ended | Balance at Beginning of Year | Additions Charged to Costs and Expenses | Less Write-offs | Balance at End of Year | ||||||||||||
| September 30, 2015 | $ | 97,950 | $ | - | $ | (18,477 | ) | $ | 79,473 | |||||||
| September 30, 2014 | 97,950 | - | - | 97,950 | ||||||||||||
| September 30, 2013 | 97,950 | - | - | 97,950 | ||||||||||||
Fair Value of Financial Instruments: The financial statements include the following financial instruments: cash and cash equivalents, short-term investments, long-term investments, accounts receivable, accounts payable and accrued expenses. Other than long-term investments, all financial instruments’ carrying values approximate fair values because of the short-term nature of the instruments. Long-term investments’ carrying value approximates fair value due to the negligible risk of changes in value due to interest rates.
Inventories: Inventories consist of finished goods, raw materials and work in process and are stated at the lower of average cost (which approximates first in, first out) or market. Inventory is valued using material costs, labor charges, and allocated factory overhead charges and consists of the following:
| September 30, 2015 | September 30, 2014 | |||||||
| Raw materials | $ | 4,811,993 | $ | 3,729,160 | ||||
| Work-in-process | 310,149 | 292,557 | ||||||
| Finished goods | 2,060,712 | 1,368,625 | ||||||
| $ | 7,182,854 | $ | 5,390,342 | |||||
Inventory is stated at the lower of cost or market. On a regular basis, the Company reviews its inventory and identifies that which is excess, slow moving, and obsolete by considering factors such as inventory levels, expected product life, and forecasted sales demand. Any identified excess, slow moving, and obsolete inventory is written down to its market value through a charge to cost of sales. It is possible that additional inventory write-down charges may be required in the future if there is a significant decline in demand for the Company’s products and the Company does not adjust its manufacturing production accordingly.
Property, Plant and Equipment: Property, plant and equipment are recorded at cost. Significant additions or improvements extending asset lives are capitalized, while repairs and maintenance are charged to expense when incurred. Depreciation is provided in amounts sufficient to relate the cost of assets to operations over their estimated useful lives. Leasehold improvements are amortized over the shorter of the remaining term of the lease or estimated life of the asset. Estimated useful lives of the assets are as follows:
| Years | ||||
| Equipment | 3 | - | 7 | |
| Leasehold improvements | 7 | - | 10 or life of lease | |
| Vehicles | 3 | |||
| 34 |
NOTE A – SUMMARY OF SIGNIFICANT ACCOUNTING POLICIES – Continued
Property, plant and equipment consist of the following:
| September 30, 2015 | September 30, 2014 | |||||||
| Manufacturing Equipment | $ | 4,102,868 | $ | 3,057,665 | ||||
| Office Equipment | 2,655,088 | 1,985,409 | ||||||
| Leasehold Improvements | 2,414,133 | 320,218 | ||||||
| Vehicles | 193,702 | 192,321 | ||||||
| 9,365,791 | 5,555,613 | |||||||
| Less accumulated depreciation | 3,676,118 | 3,093,363 | ||||||
| $ | 5,689,673 | $ | 2,462,250 | |||||
Depreciation expense for the years ended September 30, 2015, 2014 and 2013 were $1,214,512, $699,306 and $475,524, respectively.
Goodwill and Patents: The Company operates as one reporting unit and reviews the carrying amount of goodwill annually in the fourth quarter of each fiscal year and more frequently if events or changes in circumstances indicate that the carrying amount of the assets may not be recoverable. The Company determines its fair value for goodwill impairment testing purposes by calculating its market capitalization and comparing that to the Company’s carrying value. The Company’s goodwill impairment test for the years ended September 30, 2015, 2014 and 2013 resulted in excess fair value over carrying value and therefore, no adjustments were made to goodwill. During the year ended September 30, 2015, there were no triggering events that indicated goodwill could be impaired.
A significant reduction in our market capitalization or in the carrying amount of net assets of a reporting unit could result in an impairment charge. If the carrying amount of a reporting unit exceeds its fair value, the Company would measure the possible goodwill impairment loss based on an allocation of the estimate of fair value of the reporting unit to all of the underlying assets and liabilities of the reporting unit, including any previously unrecognized intangible assets. The excess of the fair value of a reporting unit over the amounts assigned to its assets and liabilities is the implied fair value of goodwill. An impairment loss is recognized to the extent that a reporting unit's recorded goodwill exceeds the implied fair value of goodwill. An impairment loss would be based on significant estimates and judgments, and if the facts and circumstances change, a potential impairment could have a material impact on the Company’s financial statements.
No impairment of goodwill has occurred during the years ended September 30, 2015, 2014 or 2013, respectively.
The Company capitalizes legal costs incurred to obtain patents. Once accepted by either the U.S. Patent Office or the equivalent office of a foreign country, these legal costs are amortized using the straight-line method over the remaining estimated lives, not exceeding 20 years. As of September 30, 2015, the Company has five patents granted and five pending applications inside the United States.
Impairment of Long-Lived Assets: The Company assesses potential impairments to its long-lived assets or asset groups when there is evidence that events occur or changes in circumstances indicate that the carrying amount of an asset or asset group may not be recovered. An impairment loss is recognized when the carrying amount of the long-lived asset or asset group is not recoverable and exceeds its fair value. The carrying amount of a long-lived asset or asset group is not recoverable if it exceeds the sum of the undiscounted cash flows expected to result from the use and eventual disposition of the asset or asset group.
| 35 |
NOTE A – SUMMARY OF SIGNIFICANT ACCOUNTING POLICIES – Continued
Any required impairment loss is measured as the amount by which the carrying amount of a long-lived asset or asset group exceeds its fair value and is recorded as a reduction in the carrying value of the related asset or asset group and a charge to operating results. No impairment of long-lived assets has occurred during the years ended September 30, 2015, 2014 and 2013.
Income Taxes: The Company records income taxes in accordance with the liability method of accounting. Deferred taxes are recognized for the estimated taxes ultimately payable or recoverable based on enacted tax law. The Company establishes a valuation allowance to reduce the deferred tax assets when it is more likely than not that a deferred tax asset will not be realizable. Changes in tax rates are reflected in the tax provision as they occur.
In accounting for uncertainty in income taxes, we recognize the financial statement benefit of a tax position only after determining that the relevant tax authority would more likely than not sustain the position following an audit. For tax positions meeting the more likely than not threshold, the amount recognized in the financial statements is the largest benefit that has a greater than 50 percent likelihood of being realized upon ultimate settlement with the relevant tax authority. As of September 30, 2015, the Company does not have any unrecognized tax benefits. The Company recognizes interest and penalties accrued on any unrecognized tax benefits as a component of income tax expense. We do not expect any material changes in our unrecognized tax benefits over the next 12 months.
Stock-Based Compensation: We measure and recognize compensation expense for all stock-based payments at fair value over the requisite service period. We use the Black-Scholes option pricing model to determine the weighted average fair value of options. For restricted stock grants, fair value is determined as the average price of the Company’s stock on the date of grant. Equity-based compensation expense is included in selling, general and administrative expenses. The determination of fair value of stock-based payment awards on the date of grant using an option-pricing model is affected by our stock price as well as by assumptions regarding a number of subjective variables. These variables include, but are not limited to, the expected stock price volatility over the term of the awards, and actual and projected employee stock option exercise behaviors.
The expected terms of the options are based on evaluations of historical and expected future employee exercise behavior. The risk-free interest rate is based on the U.S. Treasury rates at the date of grant with maturity dates approximately equal to the expected life at grant date. Volatility is based on historical and expected future volatility of the Company’s stock. The Company has not historically issued any dividends and does not expect to in the future. Forfeitures for both option and restricted stock grants are estimated at the time of the grant and revised in subsequent periods if actual forfeitures differ from estimates.
If factors change and we employ different assumptions in the determination of the fair value of grants in future periods, the related compensation expense that we record may differ significantly from what we have recorded in the current periods.
| 36 |
NOTE A – SUMMARY OF SIGNIFICANT ACCOUNTING POLICIES - Continued
Net Income Per Share: Basic and diluted net income per share is computed by dividing net income by the weighted average number of common shares outstanding and the weighted average number of dilutive shares outstanding, respectively. Weighted average common shares outstanding for the years ended September 30, 2015, 2014 and 2013 were as follows:
| Year ended September 30, | 2015 | 2014 | 2013 | |||||||||
| Net income | $ | 4,682,008 | $ | 5,432,851 | $ | 4,733,844 | ||||||
| Weighted average common shares | 13,216,010 | 12,916,273 | 12,527,153 | |||||||||
| Dilutive potential common shares | 371,522 | 685,321 | 551,786 | |||||||||
| Weighted average dilutive common shares outstanding | 13,587,532 | 13,601,594 | 13,078,939 | |||||||||
| Earnings per share: | ||||||||||||
| Basic | $ | 0.35 | $ | 0.42 | $ | 0.38 | ||||||
| Diluted | $ | 0.34 | $ | 0.40 | $ | 0.36 | ||||||
There were no potentially dilutive shares excluded from the calculation above for the years ended September 30, 2015, 2014 and 2013.
Use of Estimates: The preparation of financial statements in conformity with accounting principles generally accepted in the United States of America requires management to make estimates and assumptions that affect the reported amounts of assets and liabilities, related revenues and expenses and disclosure about contingent assets and liabilities at the date of the financial statements. Significant estimates include the deferred tax asset valuation allowance, the valuation of our inventory, rebates related to revenue recognition, performance compensation accruals and the valuation of long-lived assets and goodwill. Actual results may differ materially from these estimates.
Recently Issued Accounting Pronouncements:
In May 2014, the Financial Accounting Standards Board (“FASB”) issued guidance creating Accounting Standards Codification (“ASC”) Section 606, “Revenue from Contracts with Customers”. The new section will replace Section 605, “Revenue Recognition” and creates modifications to various other revenue accounting standards for specialized transactions and industries. The section is intended to conform revenue accounting principles with a concurrently issued International Financial Reporting Standards with previously differing treatment between United States practice and those of much of the rest of the world, as well as, to enhance disclosures related to disaggregated revenue information. The updated guidance is effective for annual reporting periods beginning after December 15, 2017, and interim periods within that reporting period. Early application is permitted only as of annual reporting periods beginning after December 15, 2016, including interim periods within that reporting period. The Company will further study the implications of this statement in order to evaluate the expected impact on its financial statements.
In July 2015, the FASB issued Accounting Standards Update (“ASU”) 2015-11, Inventory (Topic 330) Related to Simplifying the Measurement of Inventory which applies to all inventory except inventory that is measured using last-in, first-out (“LIFO”) or the retail inventory method. Inventory measured using first-in, first-out (“FIFO”) or average cost is covered by the new amendments. Inventory within the scope of the new guidance should be measured at the lower of cost and net realizable value. Net realizable value is the estimated selling prices in the ordinary course of business, less reasonably predictable costs of completion, disposal, and transportation. Subsequent measurement is unchanged for inventory measured using LIFO or the retail inventory method. The amendments will take effect for public business entities for fiscal years beginning after December 15, 2016, including interim periods within those fiscal years. The new guidance should be applied prospectively, and earlier application is permitted as of the beginning of an interim or annual reporting period. The Company is evaluating the impact of the standard on its financial statements.
| 37 |
NOTE B – COMMITMENTS AND FACILITIES
Operating Leases: The Company leases office and manufacturing facilities in Brooklyn Park, Minnesota for its ongoing operations. The lease term commenced on January 1, 2015. The Company also leases various pieces of office equipment. Certain of these leases have escalating rent payment provisions. We recognize rent expense under such leases on a straight-line basis over the term of the lease. For the years ended September 30, 2015, 2014 and 2013, total rent expense was $630,000, $505,000 and $450,000 respectively.
As of September 30, 2015, the future minimum lease payments required under operating lease agreements are as follows:
| Year ending September 30 | Operating leases | |||||
| 2016 | $ | 433,189 | ||||
| 2017 | 364,300 | |||||
| 2018 | 373,409 | |||||
| 2019 | 382,746 | |||||
| 2020 | 392,318 | |||||
| Thereafter | 1,852,117 | |||||
| Total minimum lease payments | $ | 3,798,079 | ||||
Share Repurchase: On November 13, 2014, the Company announced that its board of directors had approved a stock repurchase program under which it will purchase up to $8 million of its outstanding shares of common stock. The program does not obligate Clearfield to repurchase any particular amount of common stock during any period. The repurchase will be funded by cash on hand. The repurchase program is expected to continue indefinitely until the maximum dollar amount of shares has been repurchased or until the repurchase program is earlier modified, suspended or terminated by the board of directors. As of September 30, 2015, the Company may repurchase up to $7,151,000 of its outstanding shares of common stock.
NOTE C – SHAREHOLDERS’ EQUITY
The Board of Directors may, by resolution, establish from the undesignated shares different classes or series of shares and may fix the relative rights and preferences of shares in any class or series. The Company is authorized to issue 500 shares of preferred stock and 50,000,000 shares of common stock at $.01 par value. The Company has not issued any shares of preferred stock.
Stock-Based Compensation: The Company’s stock-based compensation plans are administered by the Compensation Committee of the Board of Directors, which selects persons to receive awards and determines the number of shares subject to each award and the terms, conditions, performance measures and other provisions of the award.
Stock Options: The Company uses the Black-Scholes option-pricing model to estimate fair value of stock-based awards. The Company did not grant stock options during the years ended September 30, 2015, 2014 and 2013.
| 38 |
NOTE C – SHAREHOLDERS’ EQUITY - Continued
The Company has two equity compensation plans which are used as an incentive for directors, officers, and other employees. The director’s plan was terminated in February of 2010 and 67,500 authorized but unissued shares were removed from the plan. Options are generally granted at fair market values determined on the date of grant and vesting normally occurs over a three to five-year period. The maximum contractual term is normally six years. However, options granted to directors have a one year vesting period and a six year contractual term. Shares issued upon exercise of a stock option are new shares. The employee plan has 354,114 shares available for issue as of September 30, 2015. As of September 30, 2015, $4,232,496 of total unrecognized compensation expense related to non-vested awards is expected to be recognized over a period of approximately 9.1 years. The number of options vested during the year ended September 30, 2015 was 59,090 with a total grant date fair value of $373,271 and a weighted average grant date fair value of $6.32. The Company recorded related compensation expense for the years ended September 30, 2015, 2014, and 2013 of $1,074,727, $794,865, and $753,727, respectively. For the year ended September 30, 2015, there were 56,767 stock options that were exercised using a cashless method of exercise. The intrinsic value of options exercised during the years ended September 30, 2015 and 2014 was $876,841 and $7,522,553, respectively. The intrinsic value of options exercisable as of September 30, 2015 is $2,420,521.
Option transactions under these plans during the years ended September 30, 2015 and 2014 are summarized as follows:
| Number of shares | Weighted average exercise price | Weighted average fair value | ||||||||||
| Outstanding at September 30, 2013 | 863,519 | $ | 3.24 | |||||||||
| Granted | - | - | - | |||||||||
| Cancelled or Forfeited | (2,450 | ) | 4.43 | |||||||||
| Exercised | (488,018 | ) | 1.94 | |||||||||
| Outstanding at September 30, 2014 | 373,051 | 4.93 | ||||||||||
| Granted | - | - | - | |||||||||
| Cancelled or Forfeited | (2,500 | ) | 6.36 | |||||||||
| Exercised | (73,167 | ) | 3.43 | |||||||||
| Outstanding at September 30, 2015 | 297,384 | $ | 5.29 | |||||||||
The following table summarizes information concerning options exercisable under the equity compensation plans:
| Year ended | Exercisable | Weighted average remaining contractual life (years) | Weighted average exercise price | |||||||||||
| September 30, 2015 | 297,384 | 1.57 | $ | 5.29 | ||||||||||
| September 30, 2014 | 313,851 | 2.63 | $ | 4.67 | ||||||||||
The following table summarizes information concerning options currently outstanding at:
| Year Ended | Number outstanding | Weighted average remaining contractual life (years) | Weighted average exercise price | Aggregate intrinsic value | ||||||||||||||
| September 30, 2015 | 297,384 | 1.57 | $ | 5.29 | $ | 2,420,521 | ||||||||||||
| September 30, 2014 | 373,051 | 2.52 | $ | 4.93 | $ | 2,908,849 | ||||||||||||
Restricted Stock: The Company’s 2007 Stock Compensation Plan permits our Compensation Committee to grant other stock-based awards. The Company awards to key employees restricted stock grants that vest over one to ten years.
| 39 |
NOTE C – SHAREHOLDERS’ EQUITY – Continued
Restricted stock transactions during the years ended September 30, 2015 and 2014 are summarized as follows:
| Number of shares | Weighted average grant date fair value | |||||||
| Unvested shares at September 30, 2013 | 292,290 | $ | 5.11 | |||||
| Granted | 307,615 | 13.39 | ||||||
| Vested | (79,390 | ) | 5.15 | |||||
| Forfeited | (2,000 | ) | 5.10 | |||||
| Unvested shares at September 30, 2014 | 518,515 | 10.02 | ||||||
| Granted | 7,300 | 13.69 | ||||||
| Vested | (101,485 | ) | 17.07 | |||||
| Forfeited | (15,200 | ) | 10.80 | |||||
| Unvested shares at September 30, 2015 | 409,130 | $ | 9.97 | |||||
The Company repurchased a total of 33,896 shares of our common stock at an average price of $16.89 in connection with payment of taxes upon the vesting of restricted stock previously issued to employees for the year ended September 30, 2015. The Company repurchased a total of 16,560 shares of our common stock at an average price of $13.61 in connection with payment of taxes upon the vesting of restricted stock previously issued to employees for the year ended September 30, 2014.
Employee Stock Purchase Plan: The Clearfield, Inc. 2010 Employee Stock Purchase Plan (“Stock Plan”) allows participating employees to purchase shares of the Company’s common stock at a discount through payroll deductions. The Stock Plan is available to all employees subject to certain eligibility requirements. Terms of the Stock Plan provide that participating employees may purchase the Company’s common stock on a voluntary after tax basis. Employees may purchase the Company’s common stock at a price that is no less than the lower of 85% of the fair market value of one share of common stock at the beginning or end of each stock purchase period or phase. The Stock Plan is carried out in six-month phases, with phases beginning on July 1 and January 1 of each calendar year. For the phases that ended on December 31, 2014 and June 30, 2015, employees purchased 10,097 and 10,119 shares, respectively, at a price of $10.46 per share. For the phases that ended on December 31, 2013 and June 30, 2014, employees purchased 10,920 and 6,669 shares, respectively, at prices of $8.28 and $14.27 per share, respectively. As of September 30, 2015, the Company has withheld approximately $62,358 from employees participating in the phase that began on July 1, 2015. After the employee purchase on June 30, 2015, 165,440 shares of common stock were available for future purchase under the Stock Plan.
NOTE D – INCOME TAXES
Realization of net operating loss carry-forward and other deferred tax temporary differences are contingent upon future taxable earnings. The Company’s deferred tax assets were reviewed for expected utilization by assessing the available positive and negative factors surrounding its recoverability.
As of September 30, 2014, the Company’s remaining valuation allowance of approximately $848,000 related to state net operating loss carry forwards. During the fourth quarter of 2015, the Company reversed a portion of its remaining valuation allowance primarily related to the expiration of state net operating losses in 2015. The remaining valuation allowance balance as of September 30, 2015 of $659,000 relates entirely to state net operating loss carry forwards we do not expect to utilize. Approximately $35,000 of the valuation allowance is short-term and $624,000 is long-term, against its remaining deferred tax assets. The Company will continue to assess the assumptions used to determine the amount of our valuation allowance and may adjust the valuation allowance in future periods based on changes in assumptions of estimated future income and other factors. If the valuation allowance is reduced, we would record an income tax benefit in the period the valuation allowance is reduced. If the valuation allowance is increased, we would record additional income tax expense.
| 40 |
NOTE D – INCOME TAXES – Continued
The valuation allowance activity for the years ended September 30, 2015, 2014 and 2013 is as follows:
| Year Ended | Balance at Beginning of Year | Income Tax Benefit | Reversal for State NOL Expiration | Balance at End of Year | ||||||||||||||
| September 30, 2015 | $ | 847,826 | $ | (53,836 | ) | $ | (135,182 | ) | $ | 658,808 | ||||||||
| September 30, 2014 | 975,258 | - | (127,432 | ) | 847,826 | |||||||||||||
| September 30, 2013 | 975,258 | - | - | 975,258 | ||||||||||||||
Significant components of deferred income tax assets and liabilities are as follows at:
| September 30, 2015 | September 30, 2014 | |||||||
| Current deferred income tax assets (liabilities): | ||||||||
| Inventories | $ | 309,791 | $ | 292,675 | ||||
| Accrued expenses and reserves | 261,452 | 297,336 | ||||||
| Prepaid expenses | (42,304 | ) | (42,722 | ) | ||||
| Net operating loss carry forwards and credits | 652,533 | 1,752,291 | ||||||
| 1,181,472 | 2,299,580 | |||||||
| Valuation allowance | (34,573 | ) | (50,145 | ) | ||||
| Net current deferred tax asset | $ | 1,146,899 | $ | 2,249,435 | ||||
| Long-term deferred income tax assets (liabilities): | ||||||||
| Intangibles | $ | (39,819 | ) | $ | (30,028 | ) | ||
| Property and equipment depreciation | (726,035 | ) | 18,091 | |||||
| Net operating loss carry forwards and credits | 938,168 | 1,531,315 | ||||||
| Stock-based compensation | 49,926 | 57,573 | ||||||
| Accrued expenses and reserves | 25,887 | 3,369 | ||||||
| Goodwill | (706,779 | ) | (626,018 | ) | ||||
| (458,652 | ) | 954,302 | ||||||
| Valuation allowance | (624,235 | ) | (797,680 | ) | ||||
| Net long-term deferred tax (liability) asset | $ | (1,082,887 | ) | $ | 156,622 | |||
As of September 30, 2015 and 2014, the current income tax receivable was approximately $48,000 and $127,000, respectively.
As of September 30, 2015, the Company had U.S. federal net operating loss (“NOL”) carry forwards of approximately $5.4 million. The U.S. federal net operating loss carry forwards will expire in 2023 through 2028 if not utilized. As of September 30, 2015, the Company had state net operating loss carry forwards of approximately $13.8 million. The state net operating loss carry forwards will expire in 2016 through 2022 if not utilized.
| 41 |
NOTE D – INCOME TAXES – Continued
The Company completed an Internal Revenue Code Section 382 analysis of the loss carry forwards in 2009 and determined then that all of the Company’s loss carry forwards are utilizable and not restricted under Section 382. The Company has not updated its Section 382 analysis subsequent to 2009 and does not believe there have been any events subsequent to 2009 that would impact the analysis.
Deferred tax assets relating to equity compensation have been reduced to reflect tax deductions in excess of previously recorded tax benefits through the year ended September 30, 2015. Our federal NOL carry forwards referenced above at September 30, 2015 include approximately $5.3 million of income tax deductions in excess of previously recorded tax benefits for equity based awards. Although the additional tax deductions are reflected in NOL carry forwards referenced above, the related tax benefit will not be recognized until the deductions reduce taxes payable.
Accordingly, since the tax benefit does not reduce the Company’s current taxes payable in 2015, these tax benefits are not reflected in the Company’s deferred tax assets presented above. The tax benefit of approximately $1,869,000 as of September 30, 2015 related to these excess deductions will be reflected as a credit to additional paid-in capital when recognized.
The following is a reconciliation of the federal statutory income tax rate to the consolidated effective tax rate as a percent of pre-tax income for the following years ended:
| September 30, 2015 | September 30, 2014 | September 30, 2013 | ||||||||||
| Federal statutory rate | 34 | % | 34 | % | 34 | % | ||||||
| State income taxes | 1 | % | 1 | % | 1 | % | ||||||
| Permanent differences | 1 | % | 2 | % | 2 | % | ||||||
| Change in valuation allowance | (3 | %) | (1 | %) | - | |||||||
| Expiration of state NOL’s | 2 | % | 1 | % | - | |||||||
| Tax rate | 35 | % | 37 | % | 37 | % | ||||||
Components of the income tax expense are as follows for the years ended:
| September 30, 2015 | September 30, 2014 | September 30, 2013 | ||||||||||
| Current: | ||||||||||||
| Federal | $ | 67,373 | $ | 115,049 | $ | 180,706 | ||||||
| State | 65,820 | 46,303 | 58,421 | |||||||||
| 133,193 | 161,352 | 239,127 | ||||||||||
| Deferred: | ||||||||||||
| Federal | 2,377,590 | 2,903,110 | 2,455,015 | |||||||||
| State | (35,545 | ) | 116,516 | 109,030 | ||||||||
| 2,342,045 | 3,019,626 | 2,564,045 | ||||||||||
| Income tax expense | $ | 2,475,238 | $ | 3,180,978 | $ | 2,803,172 | ||||||
The Company is required to recognize the financial statement benefit of a tax position only after determining that the relevant tax authority would more likely than not sustain the position following an audit. For tax positions meeting the more likely than not threshold, the amount recognized in the financial statements is the largest benefit that has a greater than 50 percent likelihood of being realized upon ultimate settlement with the relevant tax authority. The Company applies the interpretation to all tax positions for which the statute of limitations remained open. The Company had no liability for unrecognized tax benefits and did not recognize any interest or penalties during the years ended September 30, 2015, 2014, or 2013.
| 42 |
NOTE D – INCOME TAXES – Continued
The Company is subject to income taxes in the U.S. federal jurisdiction, and various state jurisdictions. Tax regulations within each jurisdiction are subject to the interpretation of the related tax laws and regulations and require significant judgment to apply. With few exceptions, the Company is no longer subject to U.S. federal, state and local, income tax examinations by tax authorities for fiscal years ending prior to 2000. We are generally subject to U.S. federal and state tax examinations for all tax years since 1999 due to our net operating loss carryforwards and the utilization of the carryforwards in years still open under statute. The Company changed its fiscal year end in 2007 from March 31 to September 30.
NOTE E – CONCENTRATIONS
Suppliers: The Company purchases critical components for our products, including injection molded parts and connectors from third parties, some of whom are single- or limited-source suppliers. If any of our suppliers are unable to ship critical components, we may be unable to manufacture and ship products to our distributors or customers. If the price of these components increases for any reason, or if these suppliers are unable or unwilling to deliver, we may have to find another source, which could result in interruptions, increased costs, delays, loss of sales and quality control problems.
Customers: The following table summarizes customers comprising 10% or more of net sales for the years ended September 30, 2015, 2014, and 2013:
| Year Ended September 30, | ||||||||||||
| 2015 | 2014 | 2013 | ||||||||||
| Customer A | 25 | % | 19 | % | 19 | % | ||||||
| Customer B | * | 21 | % | 23 | % | |||||||
* Less than 10%
As of September 30, 2015, Customers C and A accounted for 17% and 14% of accounts receivable, respectively. As of September 30, 2014, Customer C accounted for 10% of accounts receivable.
NOTE F – EMPLOYEE BENEFIT PLAN
The Company maintains a contributory 401(k) profit sharing benefit plan, whereby eligible employees may contribute a portion of their earnings, not to exceed annual amounts allowed under the Internal Revenue Code. For the years ended September 30, 2014 and 2013 and through December 31, 2014, the Company matched 100% of the first 3% and 50% of the next 2% of the participant’s eligible compensation that was contributed by the participant. Effective January 1, 2015, the Company matched 100% of the first 3% and 50% of the next 3% of the participant’s eligible compensation that was contributed by the participant. The Company’s contributions under this plan were $460,868, $379,630 and $290,652 for the years ended September 30, 2015, 2014 and 2013, respectively.
| 43 |
| ITEM 9. | CHANGES IN AND DISAGREEMENTS WITH ACCOUNTANTS ON ACCOUNTING AND FINANCIAL DISCLOSURE |
None.
ITEM 9A. CONTROLS AND PROCEDURES
Disclosure Controls and Procedures
The Company’s management carried out an evaluation, under the supervision and with the participation of the Company’s Chief Executive Officer and the Company’s Chief Financial Officer of the effectiveness of the design and operation of the Company’s disclosure controls and procedures (as such term is defined in Rule 13a-15(e) under the Securities Exchange Act of 1934, as amended) as of September 30, 2015. Based upon that evaluation, the Company’s Chief Executive Officer and the Company’s Chief Financial Officer concluded that the Company’s disclosure controls and procedures were effective.
Management’s Annual Report on Internal Control over Financial Reporting
Our management is responsible for establishing and maintaining an adequate system of internal control over financial reporting, as such term is defined in Rule 13a-15(f) of the Exchange Act. Under the supervision and with the participation of our management, including our Chief Executive Officer and our Chief Financial Officer, we conducted an evaluation of the effectiveness of our internal control over financial reporting based on the framework in the 2013 Internal Control – Integrated Framework issued by the Committee of Sponsoring Organizations of the Treadway Commission. Based on that evaluation, management concluded that, as of September 30, 2015, our internal control over financial reporting was effective. Management reviewed the results of its assessment with our Audit Committee. The effectiveness of our internal control over financial reporting as of September 30, 2015 has been audited by Baker Tilly Virchow Krause, LLP, an independent registered public accounting firm, as stated in its report which is included in Item 8 of this Annual Report on Form 10-K.
Changes in Internal Control over Financial Reporting
No changes in the Company’s internal control over financial reporting occurred during the fourth quarter of fiscal year 2015 that have materially affected, or are reasonably likely to materially affect, the Company’s internal control over financial reporting.
None.
ITEM 10. DIRECTORS, EXECUTIVE OFFICERS AND CORPORATE GOVERNANCE
Information required by Item 10 to be included in our Proxy Statement for our 2016 Annual Meeting of Shareholders (the “2016 Proxy Statement”), which will be filed with the Securities and Exchange Commission pursuant to Regulation 14A within 120 days after the end of the fiscal year for which this report is filed, is incorporated herein by reference into this section.
| 44 |
ITEM 11. EXECUTIVE COMPENSATION
The information required by Item 11 to be included in the 2016 Proxy Statement, is incorporated herein by reference into this section.
| ITEM 12. | SECURITY OWNERSHIP OF CERTAIN BENEFICIAL OWNERS AND MANAGEMENT AND RELATED STOCKHOLDER MATTERS |
The information required by Item 12 to be included in the 2016 Proxy Statement, is incorporated herein by reference into this section.
ITEM 13. CERTAIN RELATIONSHIPS AND RELATED TRANSACTIONS, AND DIRECTOR INDEPENDENCE
The information required by Item 13 to be included in the 2016 Proxy Statement, is incorporated herein by reference into this section.
ITEM 14. PRINCIPAL ACCOUNTANT FEES AND SERVICES
The information required by Item 14 to be included in the 2016 Proxy Statement, is incorporated herein by reference into this section.
ITEM 15. EXHIBITS AND FINANCIAL STATEMENT SCHEDULES
| (a) | Documents filed as part of this report. |
(1) Financial Statements.
The financial statements of Clearfield, Inc. are filed herewith under Item 8. “Financial Statements and Supplementary Data” of this Annual Report on Form 10-K.
(2) Certain financial statement schedules have been omitted because they are not required, not applicable, or the required information is provided in other financial statements or the notes to the financial statements.
| (b) | Exhibits. |
| 45 |
EXHIBIT INDEX
| Number | Description | Incorporated by Reference to |
| 3.1 | Restated Articles of Incorporation, of APA Optics, Inc. (n/k/a Clearfield, Inc.) dated November 3, 1983 and Articles of Amendment dated December 9, 1983, July 30, 1987, March 22, 1989, September 14, 1994 and August 17, 2000 | Exhibit 3.1 to Registrant’s Quarterly Report on Form 10-Q for the quarter ended September 30, 2000 |
| 3.1 (a) | Articles of Amendment to Articles of Incorporation dated August 25, 2004 | Exhibit 3.1 to Registrant’s Quarterly Report on Form 10-Q for the quarter ended September 30, 2004 |
| 3.2 | Bylaws, as amended and restated effective February 17, 1999 of Clearfield, Inc. (f/k/a APA Optics, Inc.) | Exhibit 3.2 to Registrant’s Annual Report on Form 10-KSB for the fiscal year ended March 31, 1999 |
| 10.1 | Stock Option Plan for Non-Employee Directors | Exhibit 10.3a to Registrant’s Annual Report on Form 10-KSB for the fiscal year ended March 31, 1994 |
| *10.2 | Insurance agreement by and between the Registrant and Anil K. Jain | Exhibit 10.5 to Registrant’s Annual Report on Form 10-K for the fiscal year ended March 31, 1990 |
| *10.3 | Form of Agreement regarding Indemnification of Directors and Officers with, among others Messrs. Roth and Zuckerman | Exhibit 10.7 to Registrant’s Annual Report on Form 10-K for the fiscal year ended March 31, 2002 |
| 10.4 | Lease Agreement dated May 31, 2006 between Bass Lake Realty, LLC and Clearfield, Inc. | Exhibit 10.14 to Registrant’s Annual Report on Form 10-K for the fiscal year ended March 31, 2006. |
| *10.5 | 2007 Stock Compensation Plan, as amended | Appendix A to the Registrant’s Proxy Statement for the 2011 Annual Meeting of Shareholders held on February 24, 2011. |
| *10.6 | Employment Agreement dated December 16, 2008 by and between Clearfield, Inc. and Cheryl P. Beranek. | Exhibit 10.26 to Registrant’s Current Report on Form 8-K dated December 16, 2008 |
| *10.7 | Employment Agreement dated December 16, 2008 by and between Clearfield, Inc. and John P. Hill. | Exhibit 10.27 to Registrant’s Current Report on Form 8-K dated December 16, 2008 |
| *10.8 | Clearfield, Inc. Code 280G Tax Gross Up Payment Plan Adopted November 18, 2010 | Exhibit 10.1 to Registrant’s Current Report on Form 8-K dated November 18, 2010. |
| 46 |
| Number | Description | Incorporated by Reference to |
| 10.9 | Clearfield, Inc. 2010 Employee Stock Purchase Plan | Appendix A to the Registrant’s Proxy Statement for the 2010 Annual Meeting of Shareholders held on February 25, 2010. |
| 10.10 | First Amendment to Lease and First Amendment to First Amended and Restated License Agreement dated March 28, 2013 by and between Clearfield, Inc. and Bass Lake Realty LLC | Exhibit 10.1 to Registrant’s Current Report on Form 8-K dated March 28, 2013. |
| 10.11 | Standard Form Industrial Building Lease dated September 9, 2014 by and between Clearfield, Inc. and First Industrial, L.P. | Exhibit 10.1 to Registrant’s Current Report on Form 8-K dated September 10, 2014. |
| 23.1 | Consent of Grant Thornton LLP | ** |
| 23.2 | Consent of Baker Tilly Virchow Krause, LLP | ** |
| 31.1 | Certification of Chief Executive Officer (principal executive officer) Pursuant to Rules 13a-14(a) and 15d-14(a) of the Exchange Act | ** |
| 31.2 | Certification of Chief Financial Officer (principal financial officer) Pursuant to Rules 13a-14(a) and 15d-14(a) of the Exchange Act | ** |
| 32 | Certification of Chief Executive Officer and Principal Financial Officer Pursuant to 18 U.S.C. § 1350 | ** |
| 101.INS | XBRL Instance Document | ** |
| 101.SCH | XBRL Taxonomy Extension Schema | ** |
| 101.CAL | XBRL Taxonomy Calculation Linkbase | ** |
| 101.LAB | XBRL Taxonomy Labels Linkbase | ** |
| 101.PRE | XBRL Taxonomy Presentation Linkbase | ** |
| 101.DEF | XBRL Taxonomy Definition Linkbase | ** |
* Indicates a management contract or compensatory plan or arrangement.
** Indicates exhibit filed herewith.
| 47 |
Pursuant to the requirements of Section 13 or 15(d) of the Securities Exchange Act of 1934, the Registrant has duly caused this report to be signed on its behalf by the undersigned, thereunto duly authorized.
Clearfield, Inc.
| |
| Date: November 25, 2015 | /s/ Cheryl P. Beranek |
| Cheryl P. Beranek | |
| President and Chief Executive Officer |
Pursuant to the requirements of the Securities Exchange Act of 1934, this report has been signed below by the following persons on behalf of the Registrant and in the capacities and on the dates indicated.
| 48 |
Each person whose signature appears below hereby constitutes and appoints Cheryl P. Beranek and Daniel Herzog and each of them, as his true and lawful attorney-in-fact and agent, with full power of substitution, to sign on his behalf, individually and in each capacity stated below, all amendments to this Form 10-K and to file the same, with all exhibits thereto and any other documents in connection therewith, with the Securities and Exchange Commission, granting unto said attorneys-in-fact and agents full power and authority to do and perform each and every act and thing requisite and necessary to be done in and about the premises, as fully and to all intents and purposes as each might or could do in person, hereby ratifying and confirming each act that said attorneys-in-fact and agents may lawfully do or cause to be done by virtue thereof.
| Signatures | Title | Date | ||
| /s/ Cheryl P. Beranek Cheryl P. Beranek |
President, Chief Executive Officer and Director (principal executive officer )
|
November 25, 2015 | ||
| /s/ Daniel Herzog Daniel Herzog |
Chief Financial Officer (principal financial and accounting officer)
|
November 25, 2015 | ||
| /s/ Ronald G. Roth Ronald G. Roth |
Director
|
November 25, 2015 | ||
| /s/ John G. Reddan John G. Reddan |
Director
|
November 25, 2015 | ||
| /s/ Stephen L. Zuckerman M.D. Stephen L. Zuckerman |
Director
|
November 25, 2015 | ||
| /s/ Donald R. Hayward Donald R. Hayward |
Director
|
November 25, 2015 | ||
| /s/ Charles N. Hayssen Charles N. Hayssen |
Director
|
November 25, 2015 | ||
| /s/ Patrick F. Goepel Patrick F. Goepel |
Director
|
November 25, 2015 |
49